Table of Contents
Businesses don’t have to keep it a secret anymore—bar graphs and charts are powerful tools for boosting content marketing. Not too long ago, creating the perfect chart meant hiring a designer and spending hours tweaking every detail. Today, that’s all changed. With bar graph maker apps, you can craft interactive, insightful charts on your own—in just a few minutes.
Thanks to AI-powered tools, it’s easier than ever for businesses to use visuals effectively in marketing. But with so many apps out there, picking the right one can feel overwhelming.
To make things simple, we’ve put together a list of the 10 best AI-powered graphic design apps. These tools help you create engaging bar charts quickly, even if you’re working with minimal data. Let’s take a look at which apps stand out!
How Bar Graphs Boost Content Marketing Strategies for Businesses?
Bar graphs are the best way to communicate data and information in an engaging and easy-to-understand way. They can show comparisons, trends, distributions, and proportions of different categories or variables.
- Using Bar Graph in your content marketing strategies opens up a sea of opportunities for businesses. It comes with countless benefits that include –
- Helps in attracting the attention of the audience and makes the content more appealing.
- Simplify complex data and highlight the key points or insights.
- Increases the credibility and authority of the content by providing evidence and support for the claims or arguments.
- Enhances the readability and comprehension of the content by breaking down the text into smaller chunks and using colors, labels, and legends.
Apart from benefits, bar charts/graphs have several real-life use cases, including
- Show the market share, revenue, or growth of a company or a product compared to its competitors.
- Displays the customer satisfaction, loyalty, or feedback of a brand or a service based on different criteria or segments.
- Highlights the results, outcomes, or impact of a campaign, a strategy, or a solution based on different metrics or indicators.
- Show the preferences, opinions, or behaviors of a target audience or a niche market based on different factors or variables.
As far as the role of Bar graphs in content marketing is concerned, there is no second opinion in terming it as a powerful tool to convey data and information in a clear, concise, and compelling way.
However, content marketers should also be careful to use bar graphs appropriately and accurately, by choosing the right type of bar graph, selecting the relevant data, and choosing the best Bar Graph maker app.
Top 10 Bar Graph Maker Apps for Easy Data Visualization
1). Visme App
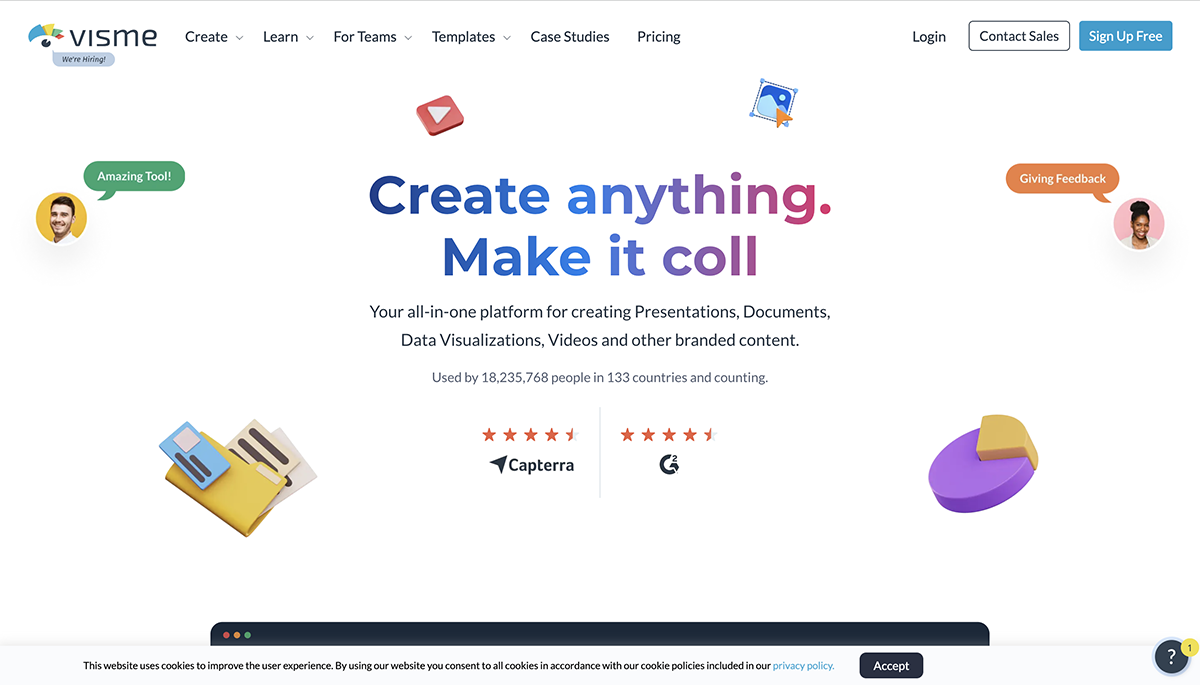
Visme is a free online tool that lets you create stunning and animated bar charts with ease. You can choose from a variety of templates that suit your needs and style. It is used by some of the leading companies because the bar charts look professional and have a high level of detail.
You can customize your charts with many features, such as fonts, colors, stock images, data widgets, and more. You only need to follow 8 simple steps to create a beautiful bar chart. We can make both vertical and horizontal charts in flat or 3D designs.
Additionally, the app allows users to import and sync their data from Excel or Google Sheets in real time. Once your bar charts are ready, you can add them to your presentations, reports, or other visual communications. You can also download them as image files and share them on social media platforms, websites, or blogs.
Pros and Cons
|
Pros |
Cons |
|
Support plenty of tools |
No refundable subscription plan |
|
Customization Options available |
Bad user experience |
|
Premium templates available |
- Pricing: Free; Subscription starts from $15.00 per month
- Ratings: 4 on Play Store and 4.3 on Apple Store.
- Direct Download Links: iOS and Android
2). EdrawMax
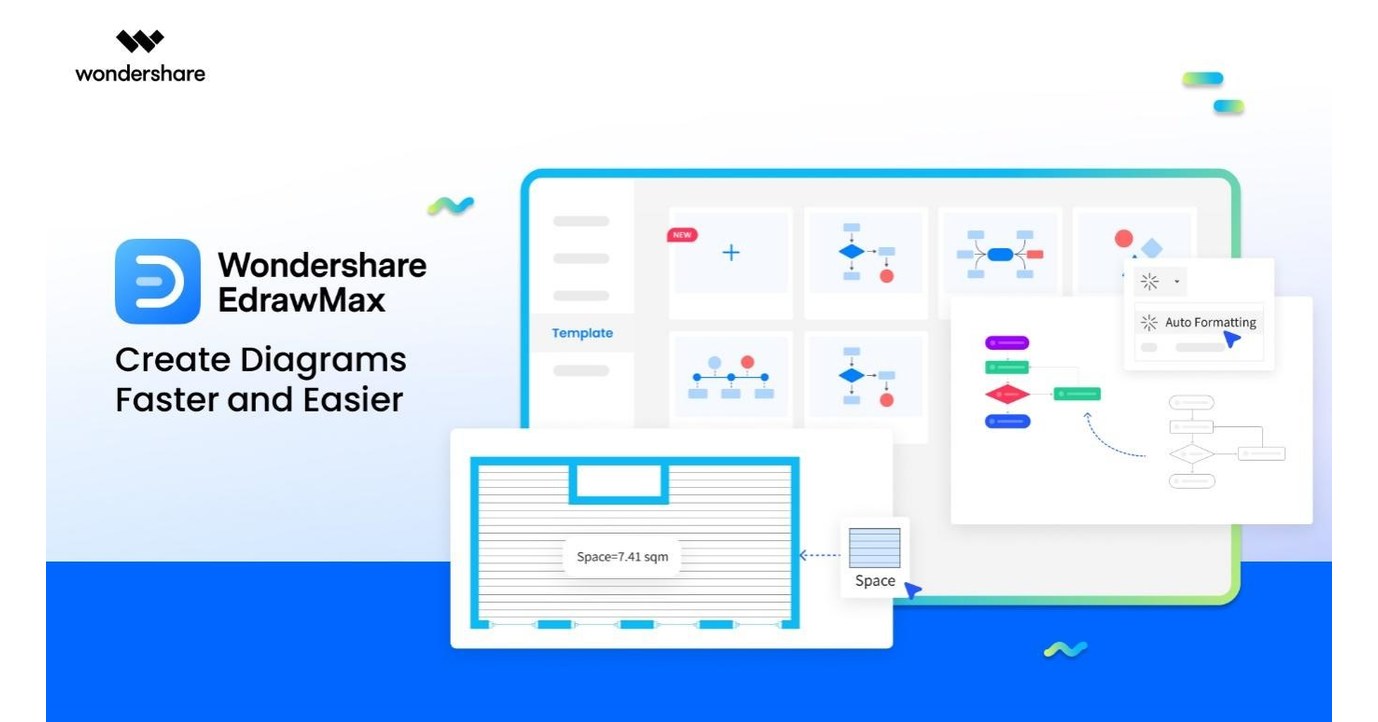
EdrawMax Online is one of the best Bar Graph maker apps that enables users to create engaging and professional bar charts with rich visual content. The software offers a dozen types of bar charts, from stacked to infographic and clustered, in just 4 easy steps.
EdrawMax is also more robust than Visio because it supports a wide range of platforms and browsers. You can use it on Windows, Mac, and Linux, and on popular browsers such as Firefox, Chrome, IE, and Safari. The application, with over 25 million users worldwide, also ensures the security and privacy of your information and files with the highest SSL encryption levels and access permission rights.
The large collection of over 1000 types of templates that come with EdrawMax also makes it easy to create and customize your charts.
Pros and Cons
|
Pros |
Cons |
|
Easy-to-understand interface |
No template combination available |
|
Affordable pricing |
No social sharing option available |
|
Premium templates available |
- Pricing: Free; Subscription ranges from $14.95 to $495.
- Ratings: 3.8 on Play Store and 5 on Apple Store.
- Direct Download Links: iOS and Android
3). Vizzlo
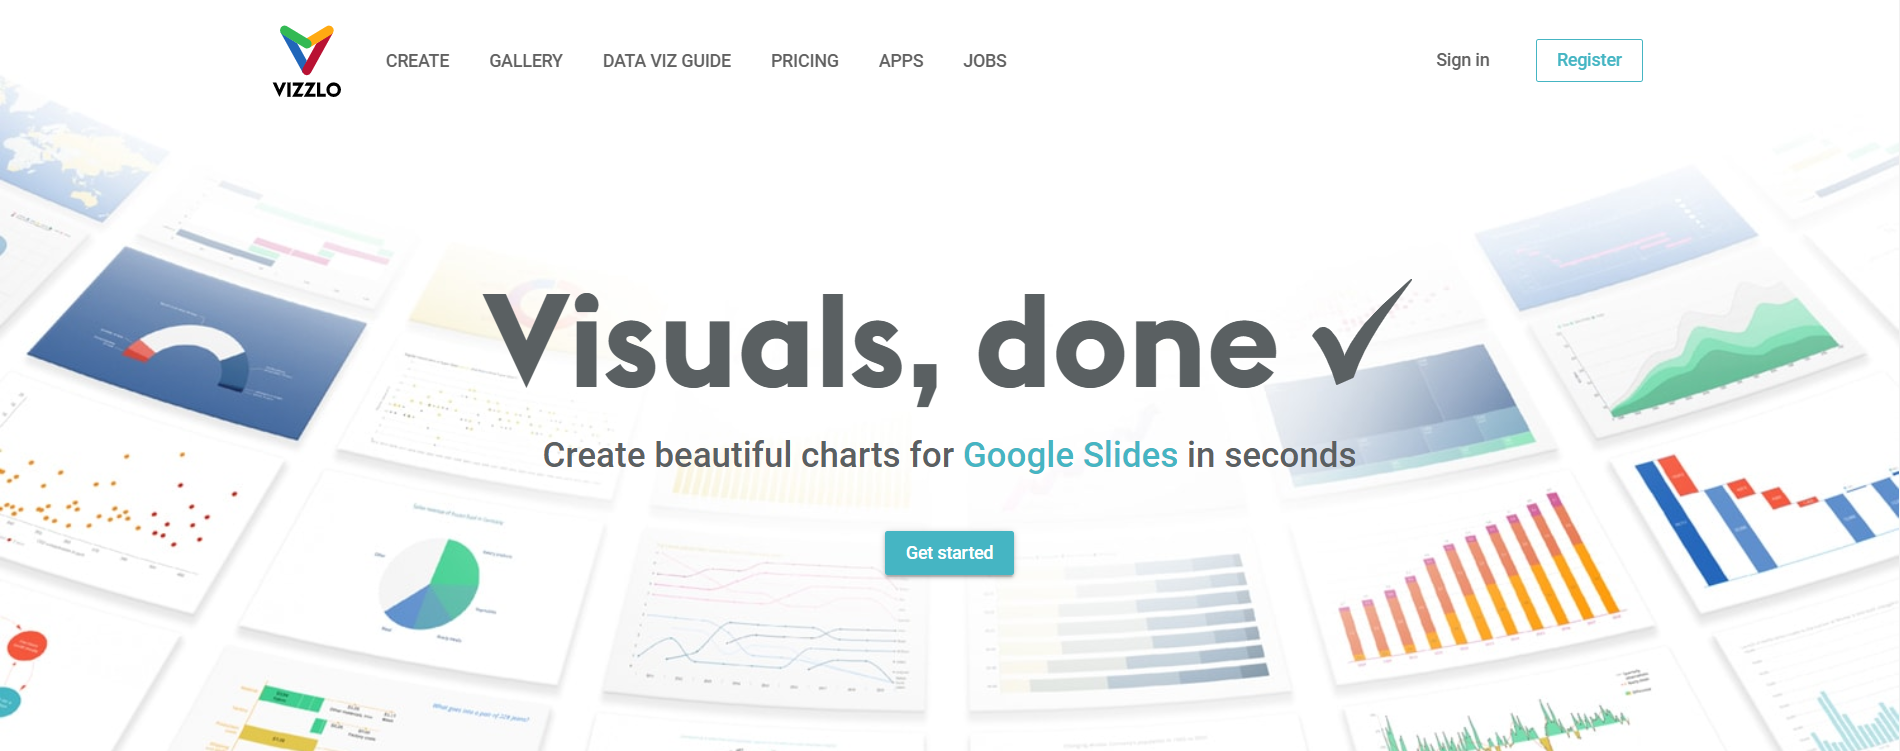
Vizzlo is probably one of the best bar graph maker platforms that has many prestigious multinational firms as its clients. Its bar charts have some advanced features that allow users to protect their data in vertical or horizontal views, and to customize the colors of the bars according to their preferences.
Users can also adjust the values of the axes and grid lines, and sort the bars in various ways. To create the graphs, users can either open a spreadsheet or import data from XSLX or CSV files.
After the data is loaded, users can fine-tune their bar charts by choosing different colors, fonts, layouts, and other elements to make them more attractive. The final graphs can be easily saved and shared as needed.
Pros and Cons
|
Pros |
Cons |
|
Quick and easy process |
Limited templates |
|
Affordable pricing |
|
|
Sytish and simple UI |
- Pricing: Free trial period of up to 14 days; Subscription starts from $11.
- Ratings: 3.7 on Mac Apple Store.
- Direct Download Links: iOS and Web
4). Fotor Bar Graph Maker
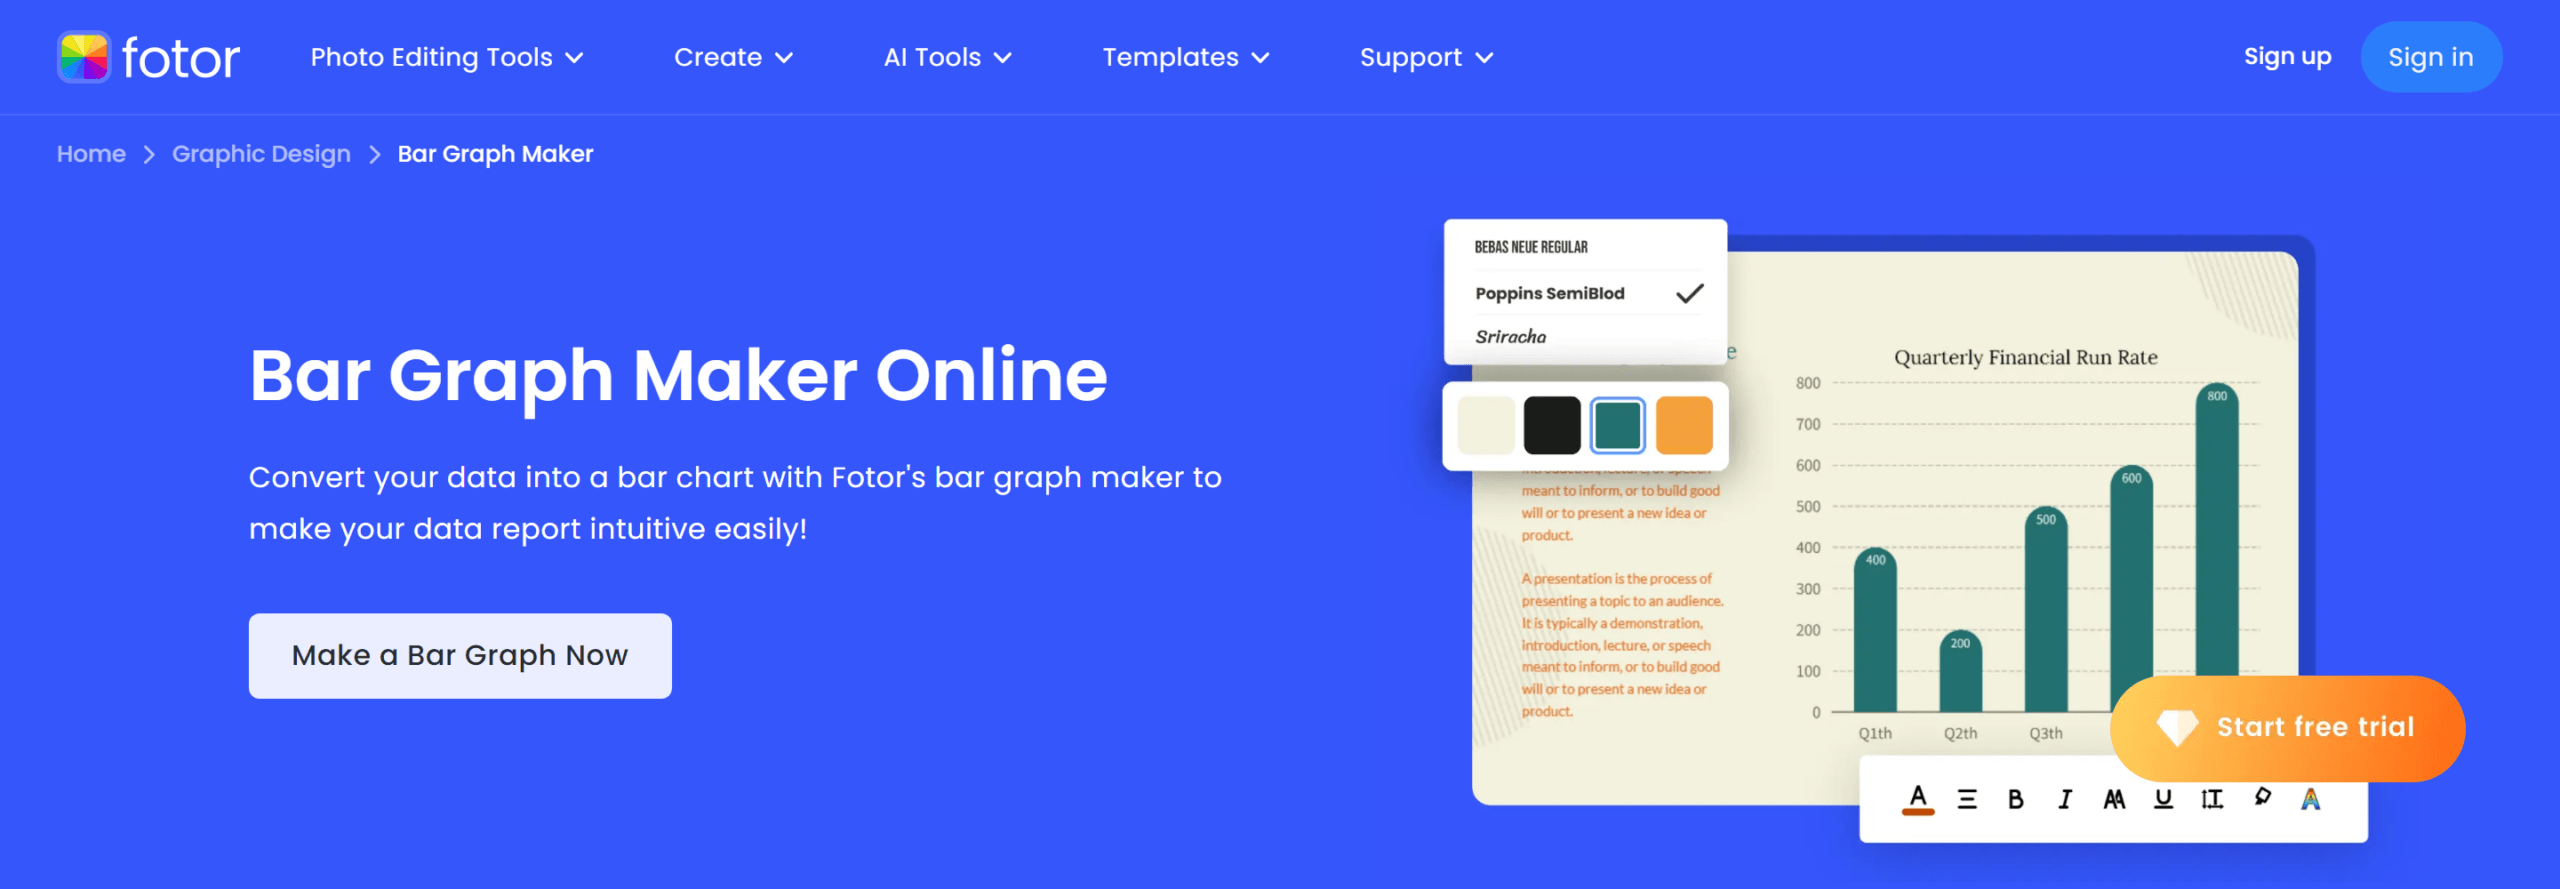
Fotor Bar Graph Maker is a tool that allows you to create bar graphs from your data in minutes. You can easily and intuitively report your data with this tool, which also has a photo editor that lets you edit photos in a few clicks.
Admin can use various free online photo editing tools to crop, resize, add text, make collages, and create graphic designs. You can also choose from multiple professional templates that suit your needs, such as single vertical bar graphs, stacked bar graphs, group bar graphs, and more.
You have full control over the template that works best for you. With Fotor Bar Graph Maker, you can visualize your data in a simple and effective way. You can also compare multiple data sets side by side with this tool, and see the differences clearly.
If you need to change or correct your data, you can do so easily with the editable templates. You just need to import your data and adjust the chart as you wish. With its various customization features, this bar graph maker is here to make your life easier.
Pros and Cons
|
Pros |
Cons |
|
Great features in free plan |
Limited templates for table charts |
|
Customization available |
|
|
Sytish and simple UI |
- Pricing: Free; Subscription starts from $8.99 monthly.
- Ratings: 4.1 on Play Store and 4.7 on Apple Store.
- Direct Download Links: iOS and Android
5). Piktochart
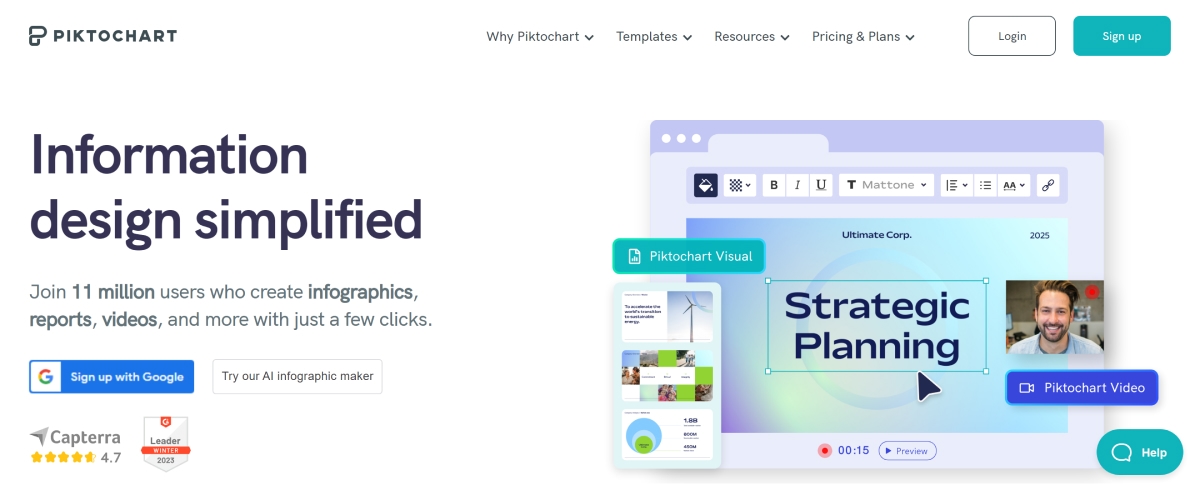
Piktochart is a tool that helps you create beautiful and engaging bar charts from your data. You can easily transform any text or data-heavy content into a stunning visual that can be used for reports, presentations, infographics, social media graphics, or printables.
Piktochart has hundreds of templates that you can choose from, depending on your needs and preferences. You can create an online bar chart in just a few clicks, by selecting the design that suits you best. You can also edit and customize the templates to fit your data and style.
Once you are done with your bar chart, you can export and download it in various formats, such as PDF, PNG, and JPG. Piktochart makes data visualization simple and fun.
Pros and Cons
|
Pros |
Cons |
|
Easy sharing options |
Complicated templates |
|
Customization available |
|
|
Simple UI |
- Pricing: Free; Subscription starts from $29 monthly.
- Website: Desktop version
6). Miro
Miro is a powerful and flexible bar graph maker AI. One of its many features is the bar graph maker, which allows you to create clear and concise bar graphs to display your data. With this feature, you can easily compare and contrast different data sets using bar graphs.
You can also customize your bar graphs by changing the titles, descriptions, and variables as you wish. Moreover, Miro’s bar graph maker supports teamwork and collaboration. You can add sticky notes to your bar graphs to communicate your ideas and insights.
You can also get real-time feedback from your team members and make your bar graphs more interactive. When you are done, you can export your bar graphs in various formats for your convenience. You can also use the presentation mode to integrate your bar graphs into your slides and share them with your audience.
Pros and Cons
|
Pros |
Cons |
|
Great collaboration tools |
Limited offline functionality |
|
Customization available |
|
|
Easy to use |
- Pricing: Free; Subscription starts from $10 monthly.
- Ratings: 4.4 on Play Store and 4.7 on Apple Store.
- Direct Download Links: iOS and Android
7). Xara
Xara lets you create bar graphs or bar diagrams from your raw data in a quick and easy way. You can choose from a variety of pre-made templates that suit your needs and preferences. You can create your bar graphs with just a few clicks and minutes.
Xara’s bar chart is trusted by over 40,000 businesses of different sizes. You don’t have to worry about the details, just enter your data and let the software do the rest for you. You can also integrate your bar graphs into your presentations smoothly and effortlessly.
Pros and Cons
|
Pros |
Cons |
|
User-friendly interface |
Costly premium plans |
|
Customization available |
Limited templates |
|
Beginner-friendly |
- Pricing: Free; Subscription starts from $12.99 monthly.
- Website: Desktop version
8). Canva
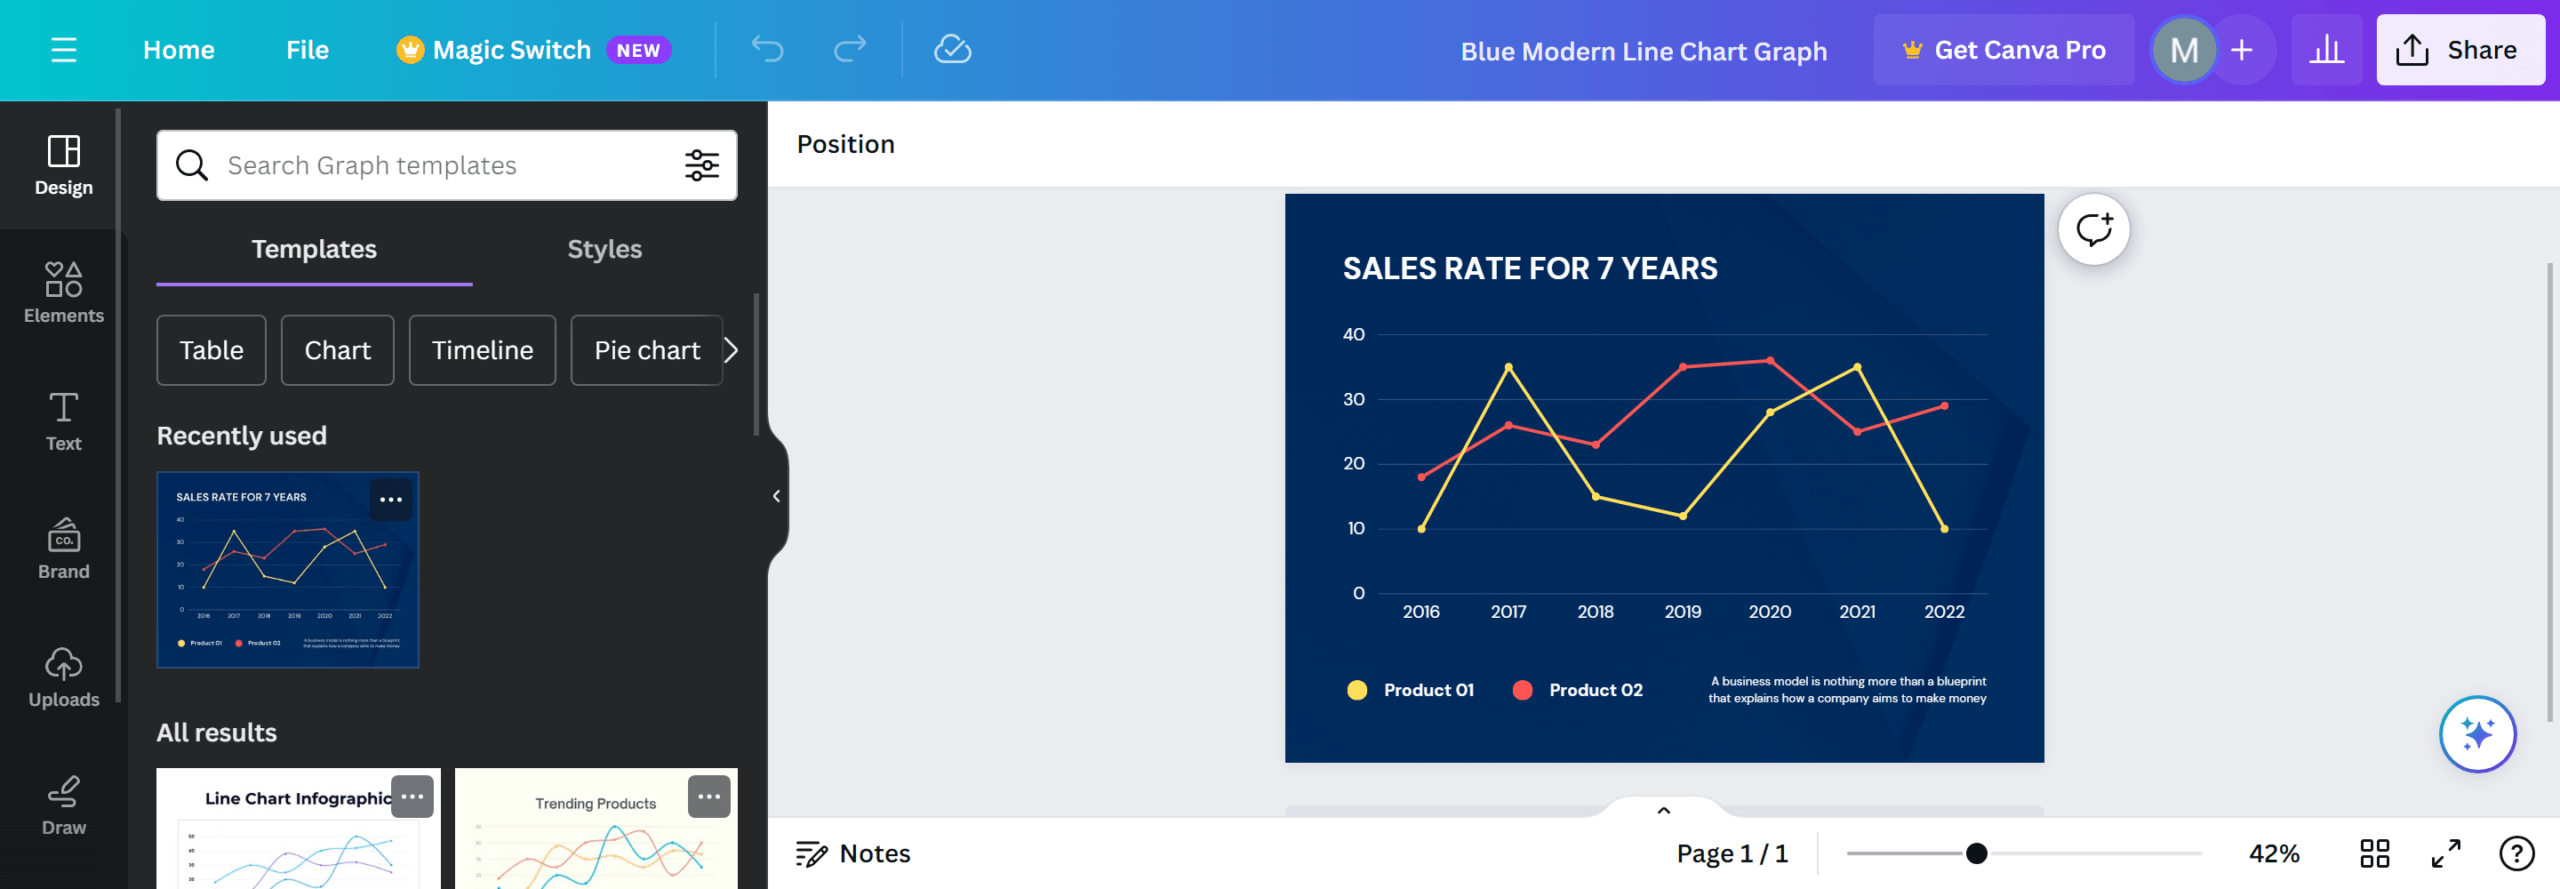
Canva is a powerful platform for graphic design that offers you a range of features and resources to create stunning visuals. Whether you are a beginner or a professional, you can use Canva to make graphics that suit your needs and preferences.
One of the features that Canva offers is the bar graph maker, which allows you to display your data in a clear and attractive way.
Here are some of the benefits of using Canva bar graph maker:
- You can choose from a variety of templates for making a bar graph on Canva, each with a different style and layout. You can also customize any template to match your brand identity or personal taste by changing the colors, fonts, shapes, and more.
- It allows you to create a professional-looking bar graph in minutes with Canva’s simple and intuitive interface. You don’t need to learn any complex software or skills to make a bar graph with Canva. You can simply drag and drop the elements you want and adjust them as you like.
- It allows you to easily share or embed your bar graph with Canva’s convenient options. You can download your bar graph as a high-quality image or PDF file, or you can embed it into your website or presentation with a code. You can also share your bar graph with your team or clients via email or social media.
Pros and Cons
|
Pros |
Cons |
|
Professionally designed templates |
Limited offline functionality |
|
Customization available |
|
|
Easy sharing option |
- Pricing: Free; Subscription starts from $14.99 monthly.
- Ratings: 4.5 on Play Store and 3.6 on Apple Store.
- Direct Download Links: iOS and Android
9). Adobe Express
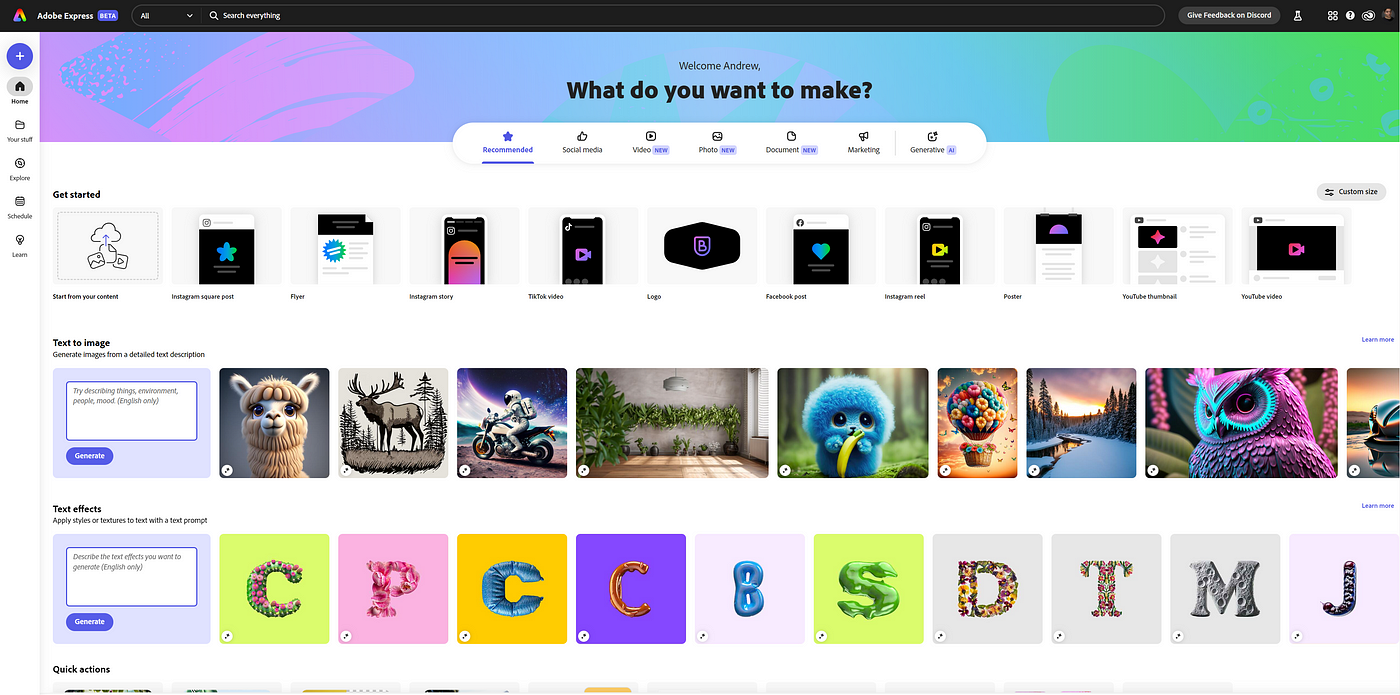
If you are looking for a free and easy way to create a bar graph, you might want to try Adobe Express. This platform allows you to make a bar graph without any design or technical skills. You just need to follow a few simple steps and you will have a beautiful and professional bar graph in no time.
One of the advantages of using Adobe Express is that it has a lot of pre-made templates that you can choose from. These templates are designed by experts and can suit any purpose or style. You can also customize them to fit your data and preferences by changing the colors, fonts, shapes, and more.
Another benefit of using Adobe Express is that it has a generous free plan that includes everything you need to create a bar graph. You can also upgrade to a premium plan if you want more features and options. Moreover, Adobe Express has a mobile app for Android and iOS, so you can make bar graphs on the go, even if you don’t have access to your laptop.
Adobe Express is very fast and smart in processing your data, so you can create a bar graph in seconds. In conclusion, Adobe Express is a great bar graph maker, especially considering that it is 100% free and has easy sharing options.
Pros and Cons
|
Pros |
Cons |
|
100GB of free cloud storage |
Lack of collaboration options |
|
Customization available |
|
|
Available on the web and mobile |
- Pricing: Free; Subscription starts from $9.99 monthly.
- Ratings: 4.5 on Play Store and 4.8 on Apple Store.
- Direct Download Links: iOS and Android
10. Infogram
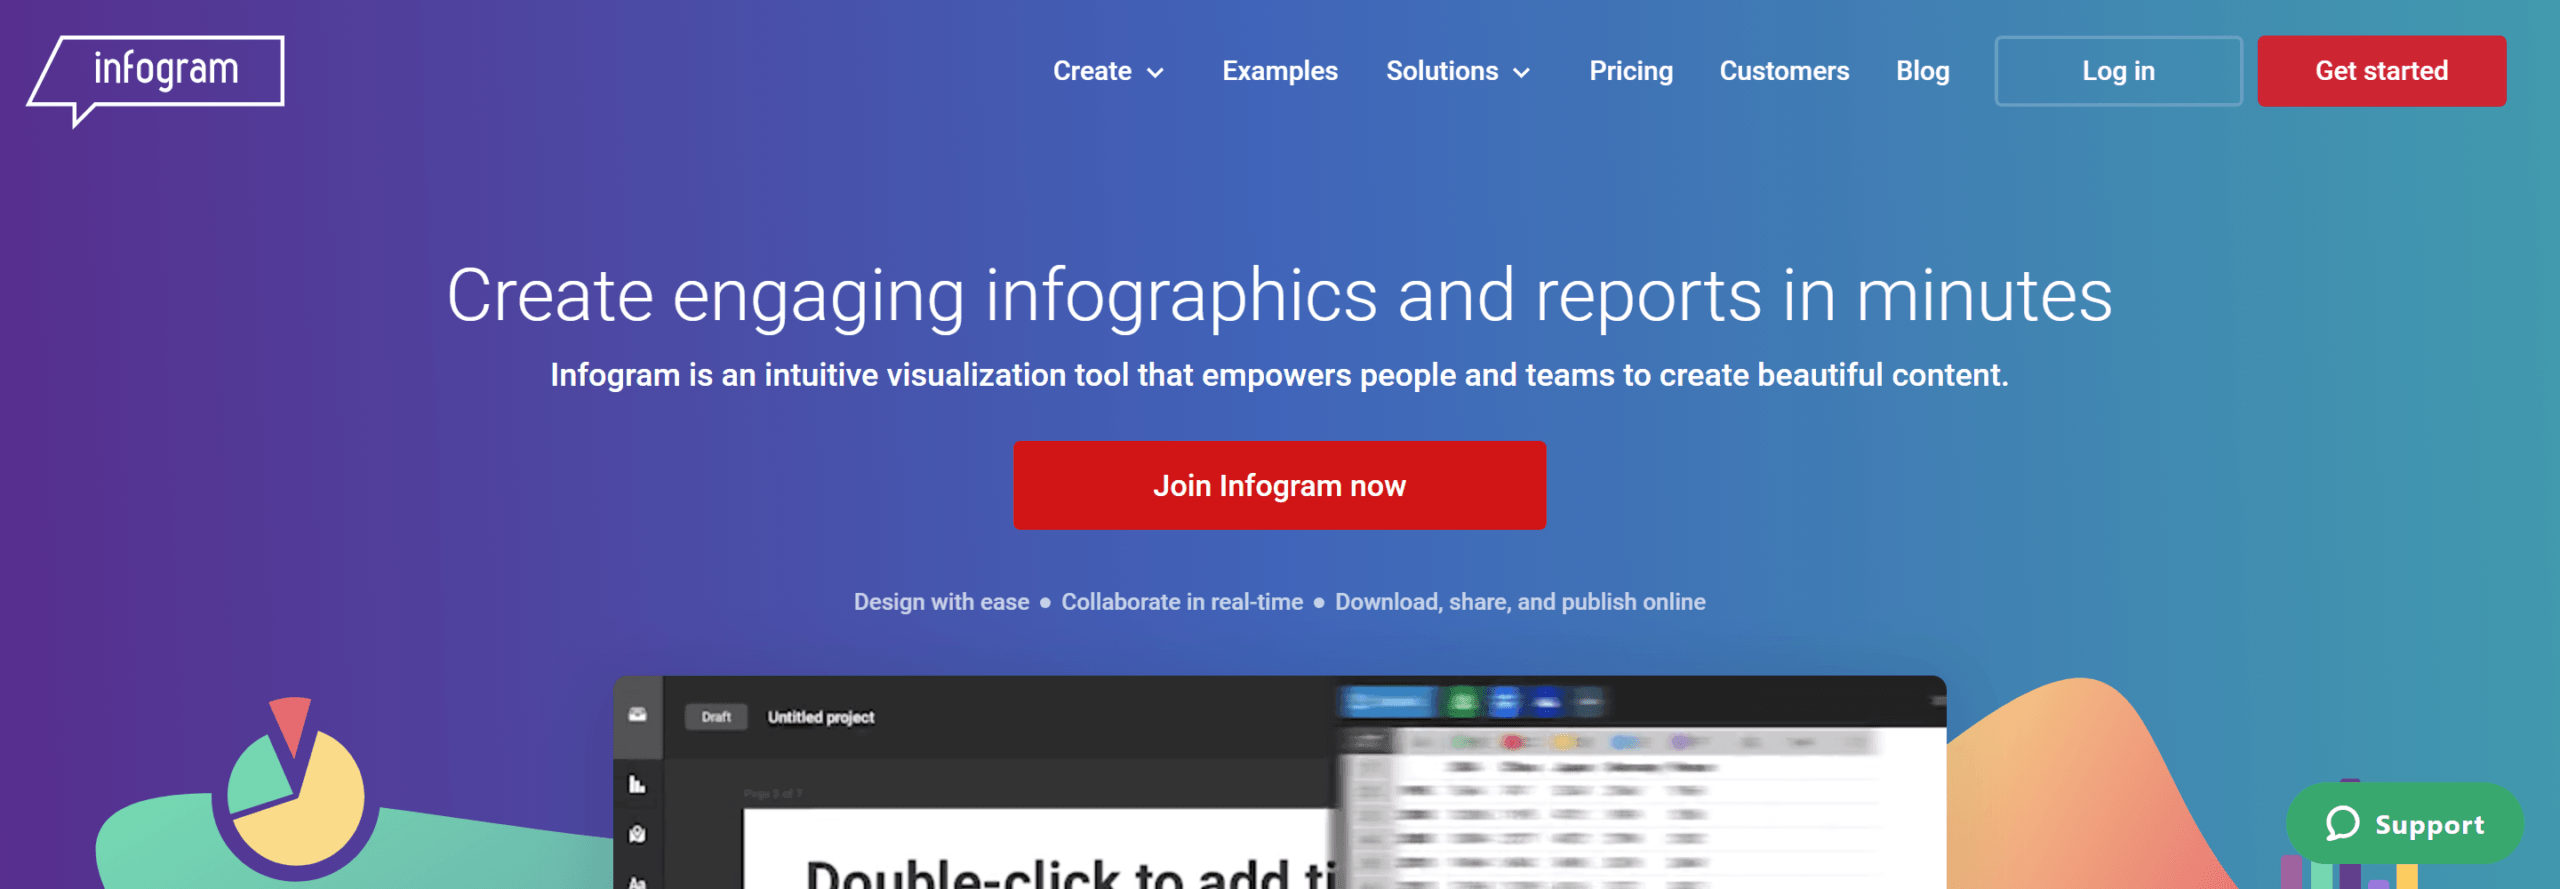
Infogram is a free online tool that lets you create stunning and interactive bar graphs in no time, without any design skills. You can choose from six different types of bar graphs, ranging from simple to complex, such as simple bar graphs, column graphs, grouped bar graphs, radial bar graphs, stacked bar graphs and progress bar graphs.
We can customize these graphs to make them look more appealing and eye-catching. We also pick from a large selection of beautiful templates to start making your bar graphs and add your own touch to them as per your needs. You can save and share your bar graphs as image files.
Infogram’s bar graphs are widely used and have various applications, such as blog survey results, statistical results, and many more.
Pros and Cons
|
Pros |
Cons |
|
Clean design |
Drag and drop feature not available |
|
Customization available |
|
|
Professionally designed templates |
- Pricing: Free; Subscription starts from $19 monthly.
- Website: Desktop version
Best 3 Bar Graph Maker Apps – Side‑by‑Side Comparison
Confused about the best Bar Graph Maker Apps? Break your confusion with a side-by-side comparison table of our top 3 picks.
|
Feature |
Canva |
Adobe Express |
Infogram |
|
Templates |
Over 500,000 templates for various design needs, including bar graphs. |
30,000 templates for different types of graphics, but only a few for bar graphs |
Over 550 templates for charts, maps, infographics, and reports, including many options for bar graphs. |
|
Ease of use |
User-friendly and intuitive interface, with a simple drag-and-drop interface and helpful tutorials |
Easy to use interface, with a similar drag-and-drop editor and a clean layout. |
Slightly more complex, but still accessible, with a data import feature and a range of customization options. |
|
Pricing |
A free plan that includes access to most templates and elements, and a Pro plan that costs $9.95 per month (billed annually) or $12.95 per month (billed monthly) that unlocks more features and resources. |
Free plan that allows you to create up to three projects and use a limited number of templates and elements, and a Premium plan that costs $9.99 per month or $99.99 per year gives you unlimited access to everything. |
A free plan that lets you create up to 10 projects and use basic templates and elements, and several paid plans that range from $19 to $149 per month (billed annually) or $25 to $179 per month (billed monthly) that offer more advanced features and integrations. |
|
Branding |
Canva lets you upload your logo, fonts, and colors, and apply them to your designs with one click. |
Adobe Express also allows you to add your own branding elements, and sync them across your projects. |
Infogram enables you to create a custom theme with your branding assets and save it for future use. |
|
Sharing and exporting |
Export your designs online via a link or on social media, or download them as PNG, JPG, PDF, or MP4 files. |
Share your graphics online via a link or on social media, or download them as PNG, JPG, PDF, PPT, or MP4 files. |
Export your charts online via a link or on social media, embed them on your website, or download them as PNG, JPG, PDF, GIF, or HTML5 files. |
How Data Visualization Enhances Mobile App Development
Data visualization is an essential aspect of mobile app development, as it can help app development companies make better decisions, create better products, and achieve better outcomes. Bar Graphs can help mobile app developers in many ways, such as
- Understanding User Behavior: Data visualization can help developers analyze how users interact with their apps, what features they use, what problems they face, and what feedback they provide. This can help developers improve their app design, functionality, and user experience.
- Identifying Trends and Patterns: Data visualization can help developers discover hidden insights and patterns in their data, such as user preferences, market demand, or competitive advantage. This can help developers innovate their app features, optimize their app performance, and increase their app value.
- Communicating and Persuading: Data visualization can help mobile app development comapanies communicate their app ideas, goals, and results to various stakeholders, such as investors, clients, or users. This can help developers attract funding, gain trust, and increase engagement.
Conclusion
We’ve rounded up the top 10 bar graph maker apps that make creating eye-catching and interactive data visualizations a breeze. With plenty of templates to choose from, you can easily find one that suits your style and fits your purpose.
These apps also give you plenty of ways to customize your charts. You can adjust colors, fonts, labels, axes, legends, and more. Some even let you add animations and transitions to make your bar charts more engaging and visually appealing.
Choose the bar graph maker that works best for you, and give your content marketing a boost with standout, professional-looking charts.
FAQs
How Do I Make My Own Bar Graph?
You can use an online tool like Canva Graph Maker to make a bar graph easily. You can choose from different templates and styles, and download or share your graph.
What Is The Free App To Create A Graph?
Graph Maker is a free app that lets you create different types of graphs, such as bar, line, pie, and scatter. You can enter your data manually or import it from a file, and adjust the colors and fonts of your graph.
How Do You Make A Bar Graph On Mobile?
You can use the Graph Maker app to make a bar graph on your mobile device. You can enter your data in a table or a list, and select the type and style of your bar graph.
What Is The Best Way To Make A Bar Graph?
The best way to make a bar graph is to follow some basic principles of data visualization. You should choose a suitable scale and range for your data, use appropriate colors and labels for your bars, and add a title and a legend for your graph.
Is There An AI that Can Create Graphs?
Yes, there are some AI tools that can create graphs from natural language queries or commands. For example, you can use Bar Graph Maker AI to generate graphs by typing or speaking what you want to see.
Can ChatGPT Create Charts And Graphs?
No, ChatGPT cannot create charts and graphs. ChatGPT is a chatbot that can generate natural language responses based on the user’s input. It cannot create visual representations of data or information.