Table of Contents
It’s hardly surprising that the mobile app development market is booming, given that there are more than 6.3 billion smartphone users worldwide. There are no immediate signals that the steady growth of app use and smartphone adoption would slow down.
Add to it the 1.14 billion tablet users globally, which has increased by nearly 36% over the last six years.
We are sure you will notice that everyone else is starting at a mobile device as well if you glance up from your phone for a moment throughout the day.
According to research, the typical American checks their phone 262 times every day! Over every 5.5 minutes, then.
We use our phones when at work, at home, out and about, eating, sleeping, and even in our automobiles. Perhaps you are going through this right now on a mobile device.
What are people using their phones for? Well, applications account for 88% of all mobile time.
It is good news for anyone who intends to create apps, as well as app publishers and developers. However, two things must take place in this area for success.
- Users must download your software.
- Users must use your software.
These two ostensibly straightforward tasks served as my inspiration for writing this tutorial. Yes, we are aware that more people than ever before are utilizing applications. But regarding the information currently accessible on this use is only the tip of the iceberg. Based only on this data, you cannot create an app.
That would be like declaring, “People enjoy eating. Therefore I am going to build a restaurant.”
You need a deeper grasp of how consumers download and use mobile applications if you want to compete and take a piece of this multi-billion-dollar market.
Use the information included in this article or design or enhances your mobile app.
Essential Mobile App Statistics till 2022
- By 2023, income from mobile applications is projected to reach over $935 billion.
- 1.96 million applications are currently available for download from the Apple App Store.
- The Google Play Store offers 2.87 million applications for downloading.
- 21% open an app more than 50 times daily of Millennial.
- 49% of users open an app 11 or more times each day.
- Mobile applications account for 70% of all US digital media consumption.
- The typical smartphone user utilizes 30 applications per month and 10 apps per day.
Mobile App Downloads
Without downloads, apps cannot succeed.
Although it seems straightforward, app owners far too often ignore this. Even if your programme is the finest globally, you won’t get paid if no one downloads it.
Therefore, you must invest the necessary time in doing the required research before you can convince them to download your app. You can select the most pertinent mobile app download data for 2022 to get you going.
Downloads Worldwide
Most people are using tablets and smartphones all around the globe.
Worldwide app downloads are rising along with the popularity of mobile app use.
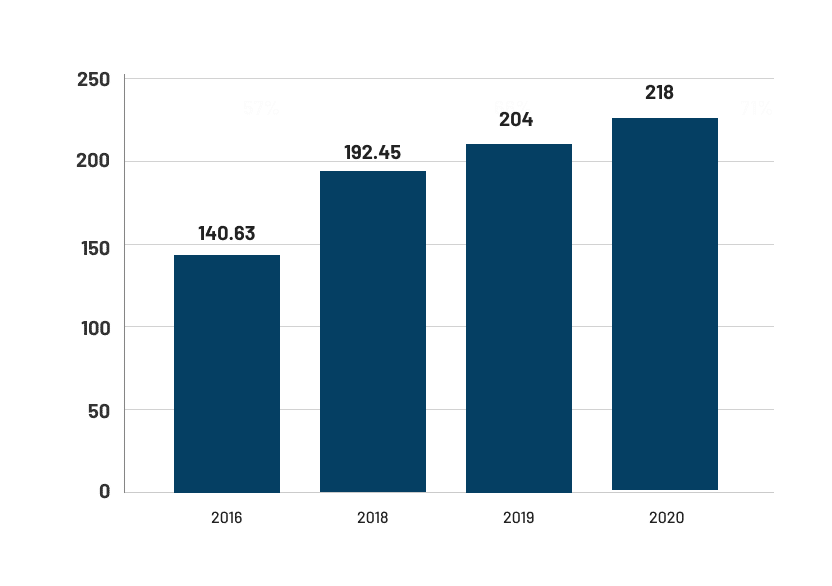
The number of app downloads is increasing yearly. The following years will also see a continuation of this pattern.
218 billion plus apps were downloaded last year. That is a nearly 7% increase from the previous year.
The graph shows a 55% increase between 2016 and 2020. Though not nearly as pronounced, the increase rate is increasing yearly.
Free vs. Paid Downloads
Your monetization plan should be one of the first considerations when developing a mobile app.
That is the primary motivation for your app development, correct, to get profit? You may have thought of charging for app downloads.
But would users still download your software if you charge for it?
Let’s examine the number of downloads for free and paid apps.
Nearly all global downloads are free.
In actuality, free applications generate 98% of all app income globally. Only a tiny percentage of consumers are prepared to pay for downloads.
Please understand that I’m not advocating that you abandon the concept of releasing a paid application altogether. Both approaches offer advantages depending on the kind of app you have.
Few mobile users will download the app if you charge for downloads at first. It is due to the fact that most individuals are used to getting free downloads.
Take a quick look at your smartphone.
Do you have any installed software that you have purchased?
You are not the majority if you do.
However, consumers of paid apps are more likely to be frequent users.
They will not spend money on items they would never use.
However, even if you don’t charge for downloads, your programme may still bring in money.
If you run an established company and have an app as an extension, you should give free downloads to get multiple customers.
Users are not expected to pay for downloads.
It’s because most apps sold on the Google Play Store and the Apple App Store are gratis.
Based on information from Statista as of December 2021, the graph above was created.
Offering your software for free is still a viable business model, even if you are just starting. There are many additional ways to monetize your website or app, including by allowing in-app purchases.
Review the most recent data on mobile commerce income and use it if you are utilizing your app to sell goods and services.
App Store vs. Google Play Downloads
The vast majority of mobile consumers obtain applications from two different sources.
Users of Android apps download from the Google Play Store, while iOS users download from the Apple App Store.
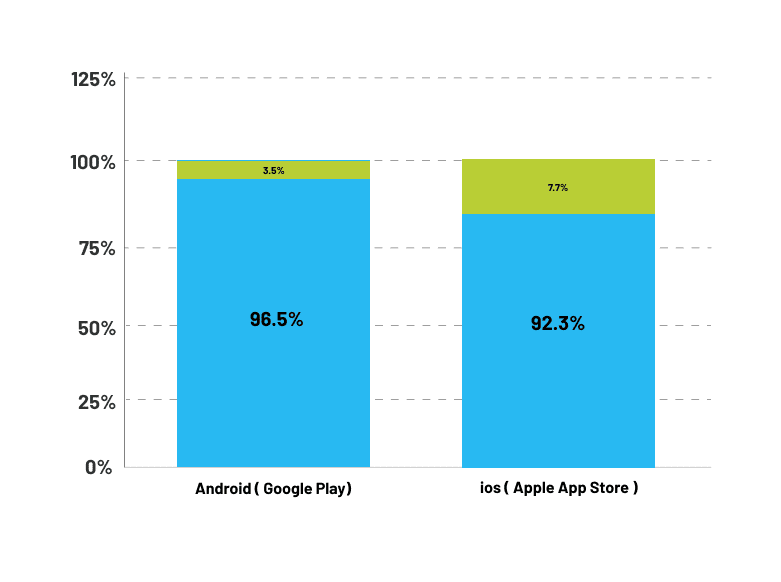
Take a look at how these two platforms stack up in terms of worldwide app downloads.
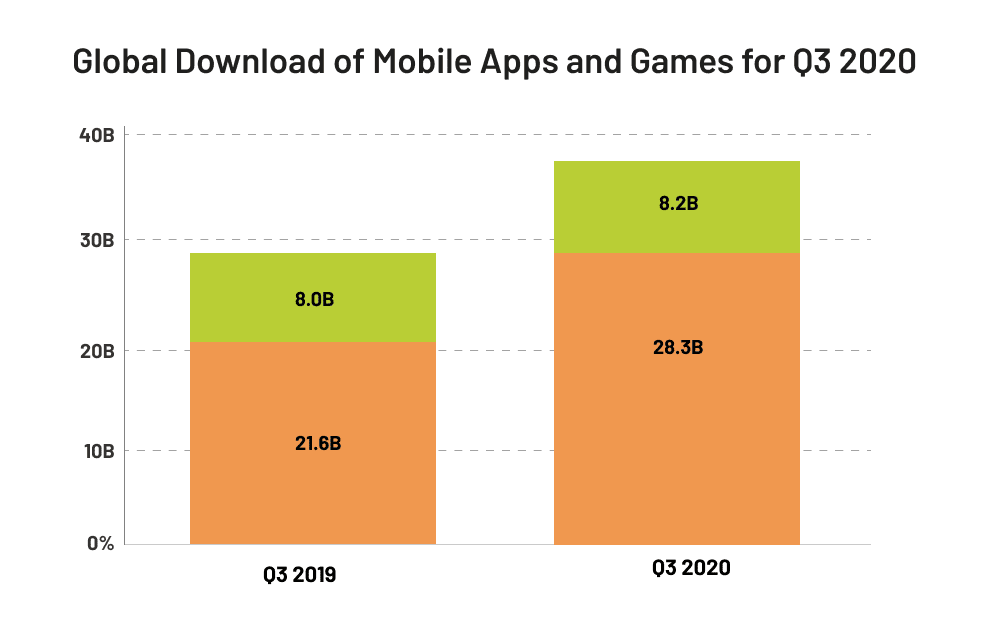
More downloads are arriving from the Google Play Store globally. However, as you can see, the portion of downloads increased in both shops from 2019 to 2020. Downloads from the Google Play Store increased by 31%, while those from the Apple App Store only increased by 2.5%. The Google Play Store is expanding faster and has more downloads.
In 2022, we expect that these trends will go on.
Note: Not sure which platform to develop for initially? You don’t need to choose that with Mtoag. You may concurrently design an iOS and Android app using the Mtoag platform in order to debut on both stores and encourage as many consumers to download as possible.
Statistics for Apple App Store Downloads
The two app shop’s comparisons to one another have previously been covered. But now it’s time to examine each platform more closely and dissect these figures with mobile app development trends.
Let’s start with the download data from the Apple App Store.
Popular Categories in the App Store
You must comprehend what users desire if you want your app to be successful. In particular, if you are creating a new app, this is true. Even if your app is ground-breaking in terms of software or idea, you won’t gain many downloads if it isn’t needed.
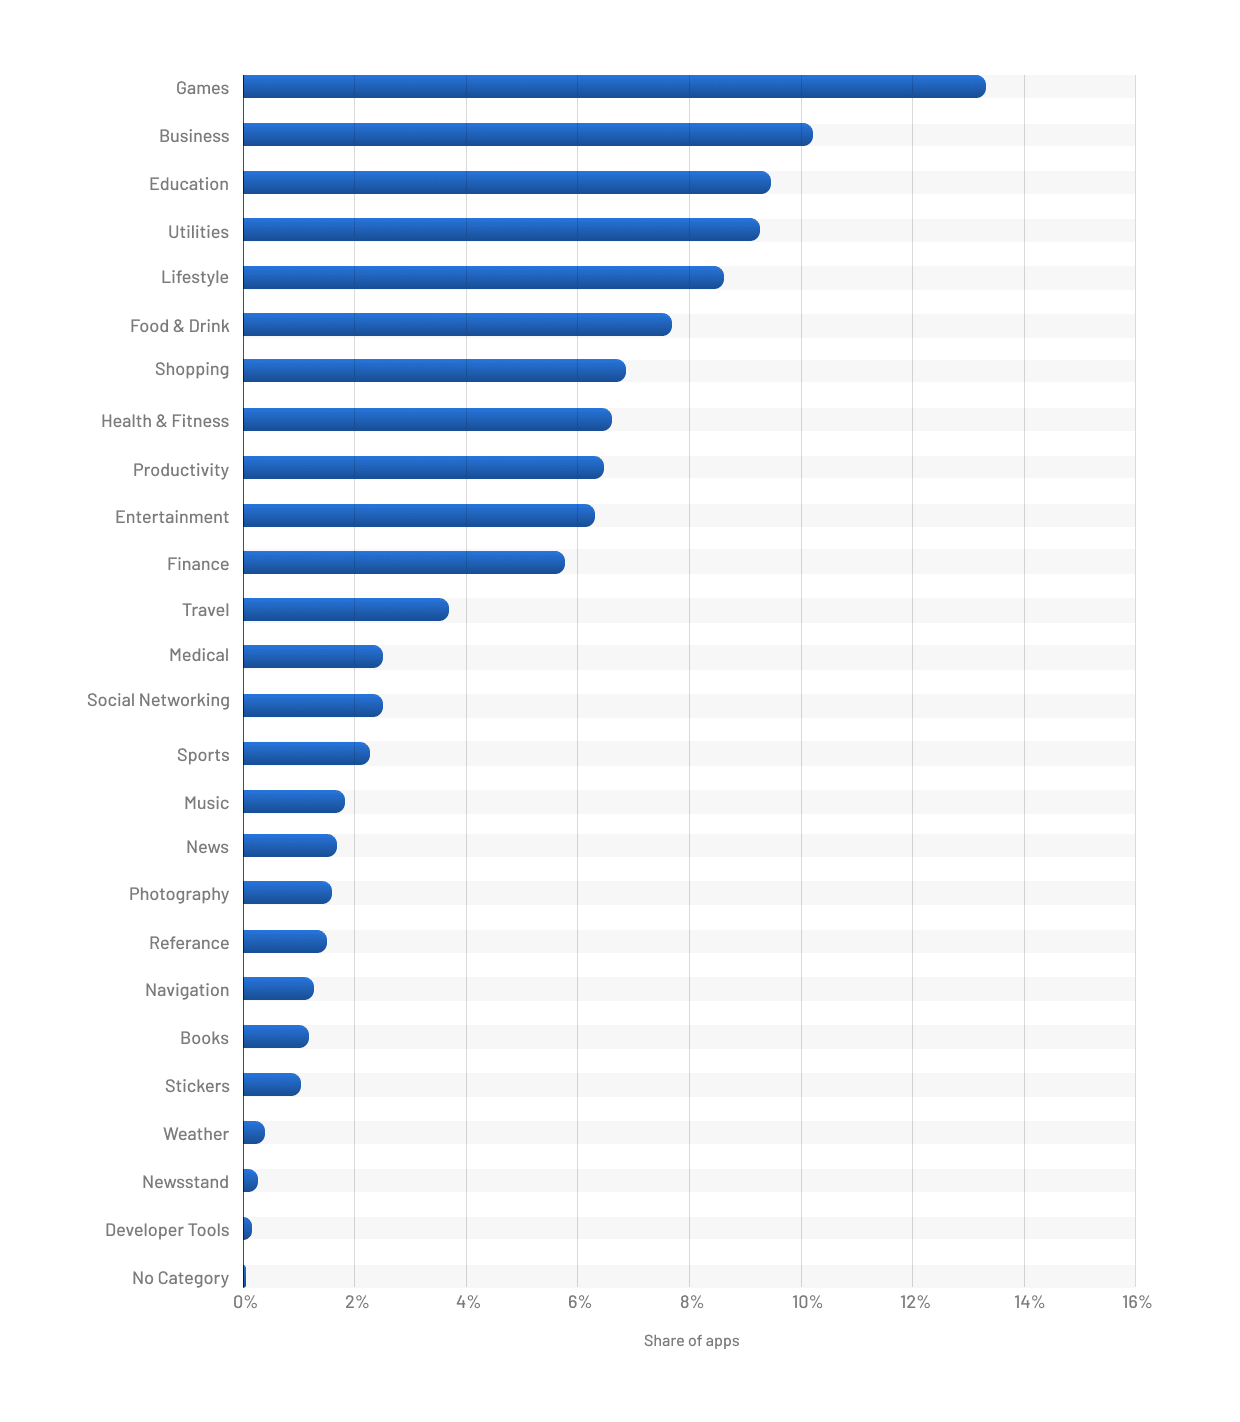
You should first be familiar with the most popular app categories. According to an availability share, these are the Apple App Store’s most popular categories.
The games sector dominates the App Store.
But you probably won’t have internet browsing unless you are willing to redesign your software altogether. Say, for illustration, that you own an online business. Launching a gaming app for your company solely to get into a more well-liked category doesn’t make sense.
Your app’s category has to be appropriate for its operations and goals. So you can’t merely classify your app as a social media to attempt to obtain more downloads if you operate a business or lifestyle app. Failing to choose a category for your app’s primary function is against the App Store review criteria.
Your software may be withdrawn from the App Store if you violate these rules. Naturally, if this occurs, no one will be able to download your programme.
Don’t attempt to manipulate the system, then. Even if your app isn’t in the top category, it still has a chance of becoming successful. There is higher competition in such areas. Depending on your approach, you can strive to capture a more significant proportion of a more limited market by focusing on a specialized category that is less competitive.
Availability on the Apple App Store
The mobile app market is very competitive. But how many other applications will be in competition? Check out how many applications are offered in the Apple App Store. Every year, there are more applications available.
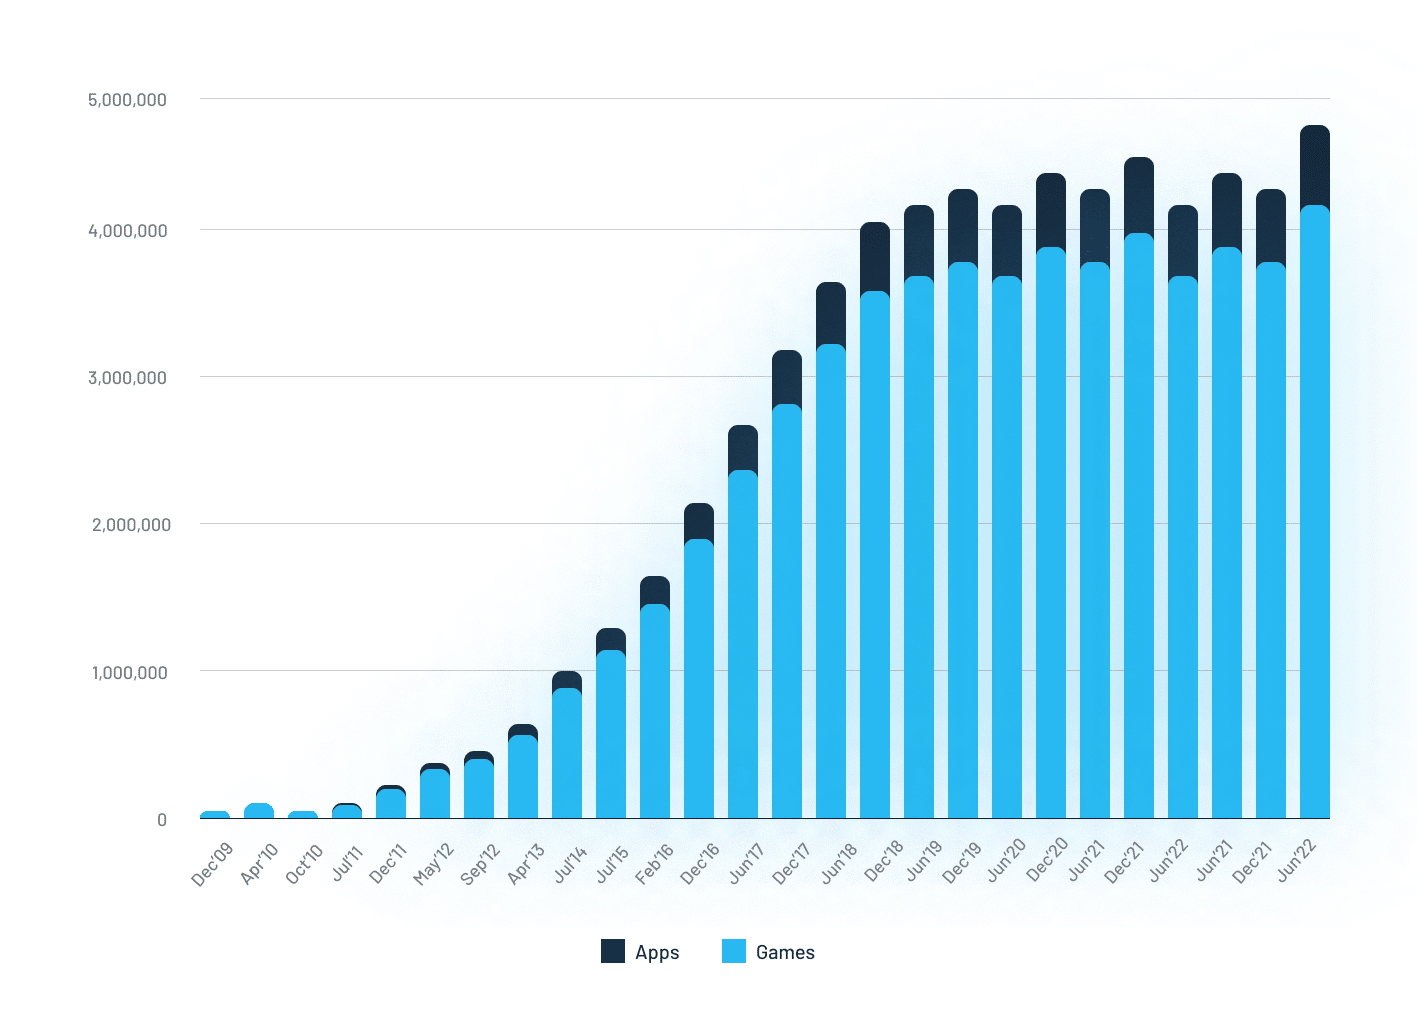
It makes logical in light of all the data we have examined so far. The number of mobile device owners is at an all-time high, and app downloads are also at an all-time high. So it makes sense that more applications are being released to the market.
But are more applications being made accessible? The reason why app download statistics are increasing? Or are more applications accessible because so many more apps have been released?
It’s difficult to say, and both sides have valid points. After reviewing the Google Play Store, we will better understand this logic.
Download Statistics for the Google Play Store
It is now time to review the data about Android device downloads. You need to invest the necessary effort in producing a more thorough examination of the Google Play Store.
Availability of the Google Play Store
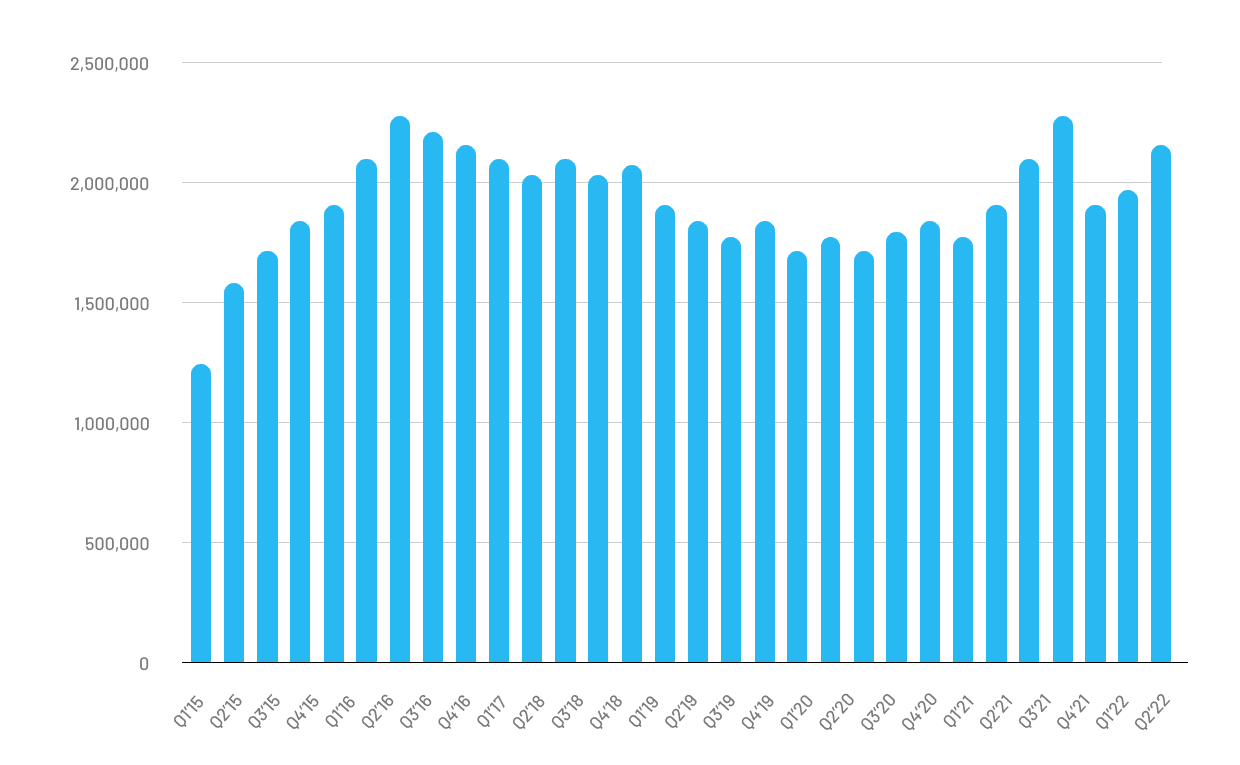
We have just completed examining the availability of the Apple App Store. So, let’s go right to it and show you how many applications there are to choose from in the Google Play Store.
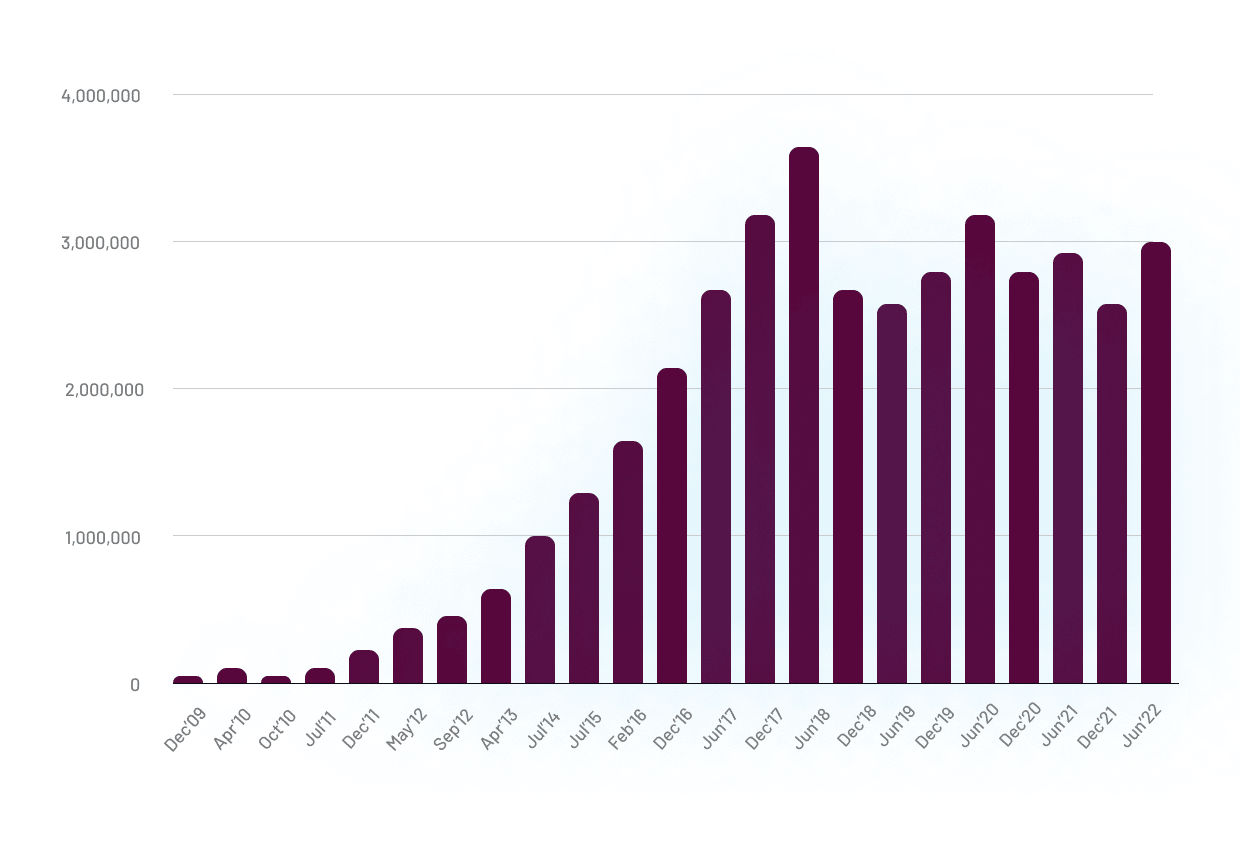
You can observe that the graph’s trajectory differs from the Apple graph’s for the same category. The availability of apps decreased after the middle of 2017. Nevertheless, since then, the number of applications has been consistently growing.
Why is this taking place?
The Google Play Store has a lot of rivalries. Some applications just couldn’t survive. Not another downhill trajectory, in my opinion. The trend line should continue growing for the foreseeable future, according to the statistics from the last two years.
As we have previously seen, despite a slight decline in the number of applications available for download during that time, Google Play Store downloads are still on the rise. Relating this to our discussion about Apple will be helpful. The number of apps currently available in the Apple App Store is increasing yearly, but the download growth rate is lower than in the Google Play Store. This data leads me to believe that it’s reasonable to say that increasing app downloads aren’t related to the number of applications offered on each store.
Most Popular App Categories on the Google Play Store
Based on penetration, you may assess an app category’s success. These app categories have the most significant penetration rates among Android users, according to Statista.
Tools —99.81%
Communication rate— 99.93%
Commercial — 99.33%
Editing and Video Players — 96.63%
Local and travel — 95.7%
Social — 95.02%
Productivity — 91.67%
Audio and music — 88.38%
Entertainment — 83.75%
Magazines and news — 81.11%
Photographers — 75.77%
Reference & Books — 70.74%
Lifestyle — 65.57%
Individualization— 61.62%
Casual games —58.86%
Gaming (Puzzle) — 56.5%
Games — 55.08%
Purchasing — 35.79%
Action-packed games— 34.19%
Climate— 32.46%
Some of these categories should be viewed with caution. Take a peek at the list’s top categories as an example. All Android smartphones most likely come pre-loaded with specific applications, including communication apps.
Apart from that, though, this list provides a solid indicator of the kinds of applications that Android users have downloaded (apps like WhatsApp, Snapchat, Netflix, TikTok, Spotify, and Tinder). However, just because an app is loaded on a device doesn’t always indicate that someone is using it. As we examine the facts around mobile app use, we’ll go into more detail about this idea.
Use of Mobile Apps
It’s time to examine how people utilize mobile applications now that you have seen how consumers throughout the globe download apps. The typical smartphone user uses their gadget for 3 hours and 10 minutes daily. Of this time, around 2 hours and 51 minutes are spent using applications (apps make up about 90% of smartphone use).
The typical smartphone has more than 80 applications loaded, according to research. It is said to be that not everyone is utilizing all of those applications.
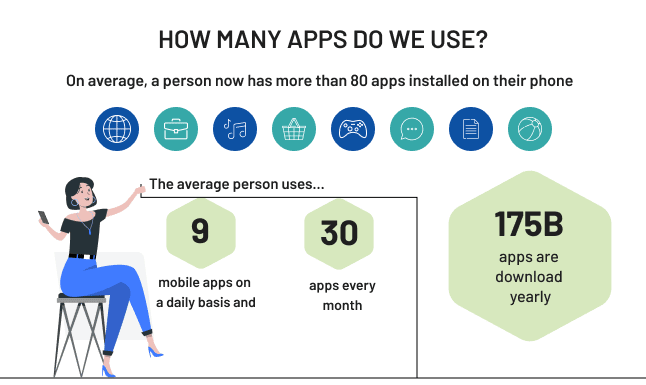
The particular user utilizes nine mobile applications daily and 30 apps monthly. If an average smartphone user has 80 applications installed, then more than 62% of those apps aren’t utilized every month.
Why does this matter? It’s easy. Apps are being downloaded but not being used by users. In actuality, 25% of downloaded programmes are only used once and never utilized again.
Further, this tutorial will delve more deeply into app use data.
Churn and Retention in Mobile Apps
After a download, app utilization is not assured, as you have just discovered. If your app has already been out to the market, some of you may already be aware of this. Although the number of downloads may have initially increased, the software isn’t being used by users, which makes it difficult for you to generate money. When I counsel app owners, I often run into this issue.
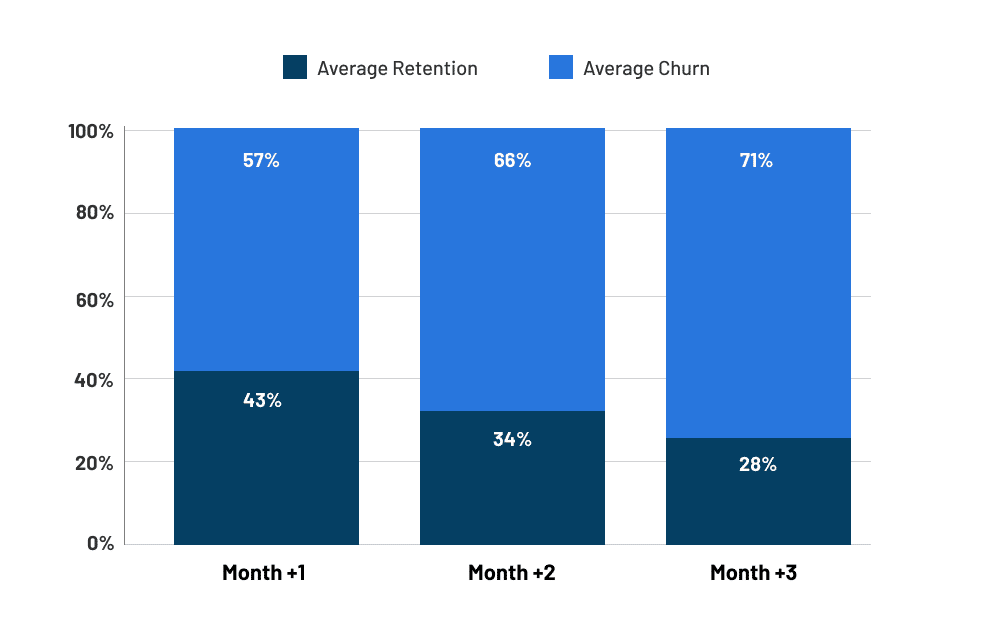
However, how can you tell whether this is taking place for you? Retention and turnover rates are the most accurate indicators of this. Within the first 90 days after installing an app, 71% of users churn.
What does this indicate for you and your app?
In essence, you must monitor these indicators. Give consumers a reason to return and use your app in the future.
Since retention rates will never be 100%, you must always find new strategies to encourage downloads. Having stated that, it does not follow that you should disregard current users.
People are likelier to abandon your programme if it has problems, malfunctions, and poor user experience (UX). No app is flawless. Even the most famous programmers sometimes have flaws. However, it is up to you to spot such mistakes. Create new versions and updates for your programme to enhance its functionality and user experience.
Most Essential Apps
We previously discussed app penetration by category and app popularity in terms of what is available for download.
However, just because they are accessible does not imply they are being used. The apps downloaded do not always guarantee that they are utilized. We previously have seen the evidence to support that statement.
We would like to demonstrate the applications users claim they cannot live without.
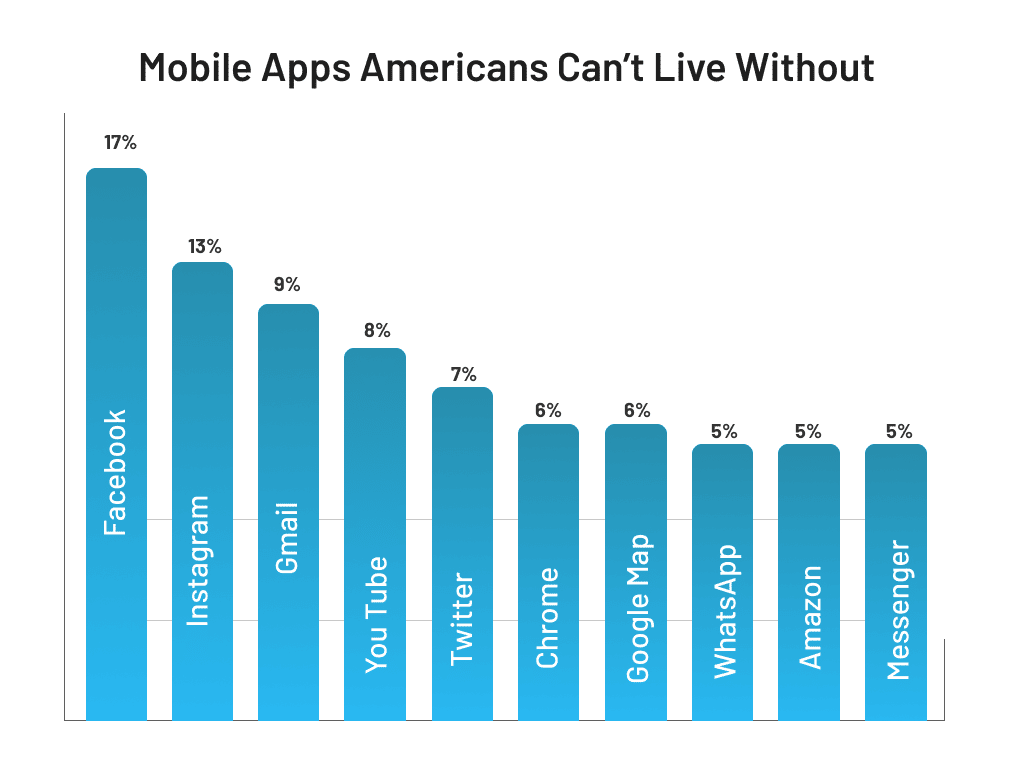
It makes sense if you look at this list. The top applications are helpful for various things and may be used often.
- Instagram and Facebook are examples of social media.
- Gmail is a popular email service.
- Use of YouTube for video material
- Navigational maps
- Use Amazon for internet purchasing
- Use WhatsApp and Messenger for instant messaging
- Chrome for Internet surfing
We can’t say that we advise creating a new mobile app that competes with one of these top applications for those who wish to do so.
Aiming high has no adverse consequences. You may still create a successful mobile app development for your company. But if you wanted your app to become the next Amazon, it would be, put it mildly, an uphill struggle. Are GPS map services compatible with app development? Sure. Will it beat Google Maps, though? Most likely not.
Global Spending on Apple and Android
We have seen that Apple and Android smartphones have some download and use disparities. Why?
The users aren’t the same, however. Users of Apple and Android act differently, as you can see if you compare the two groups.
Let’s first examine how people use their gadgets to make purchases. Here are the most recent statistics for Q3 2021:
- Gross app sales on the Google Play Store: $12.1 billion
- Gross app revenue from the Apple App Store: $21.5 billion
These figures reflect the amount spent on in-app purchases, subscriptions, and paid app downloads.
Apple consumers still spend more money, despite having a lesser market share for mobile apps. Spending on apps is dominated by Apple consumers, who spend roughly twice as much as Android users.
While all users should find your app helpful, you will have more success convincing iOS users to pay for premium upgrades and other in-app payments.
Age-Related Mobile App Usage
Generations use technology differently. The usage of mobile apps is not an exception.
You probably imagined that younger generations use mobile applications more often than older generations do. If so, the supposition was accurate. But it doesn’t exclude you from aiming for other age groups. The graph shows that individuals between the ages of 45 and 54 spend around one hour and fifteen minutes daily using mobile applications. Just 27 minutes less than persons in the 25 to 34-year-old age group. Even smartphone users over 65 spend nearly an hour daily using applications.
Device Usage of Mobile Apps
The use of mobile devices varies widely. The kind of mobile device that individuals use will affect utilization in addition to the variations across operating systems.
Use of Smartphone Apps
There are various gadgets available for consuming digital information. People use laptops, desktop computers, tablets, and smartphones. Even smart watches, smart homes, smart cars, and smart TVs can access information and applications.
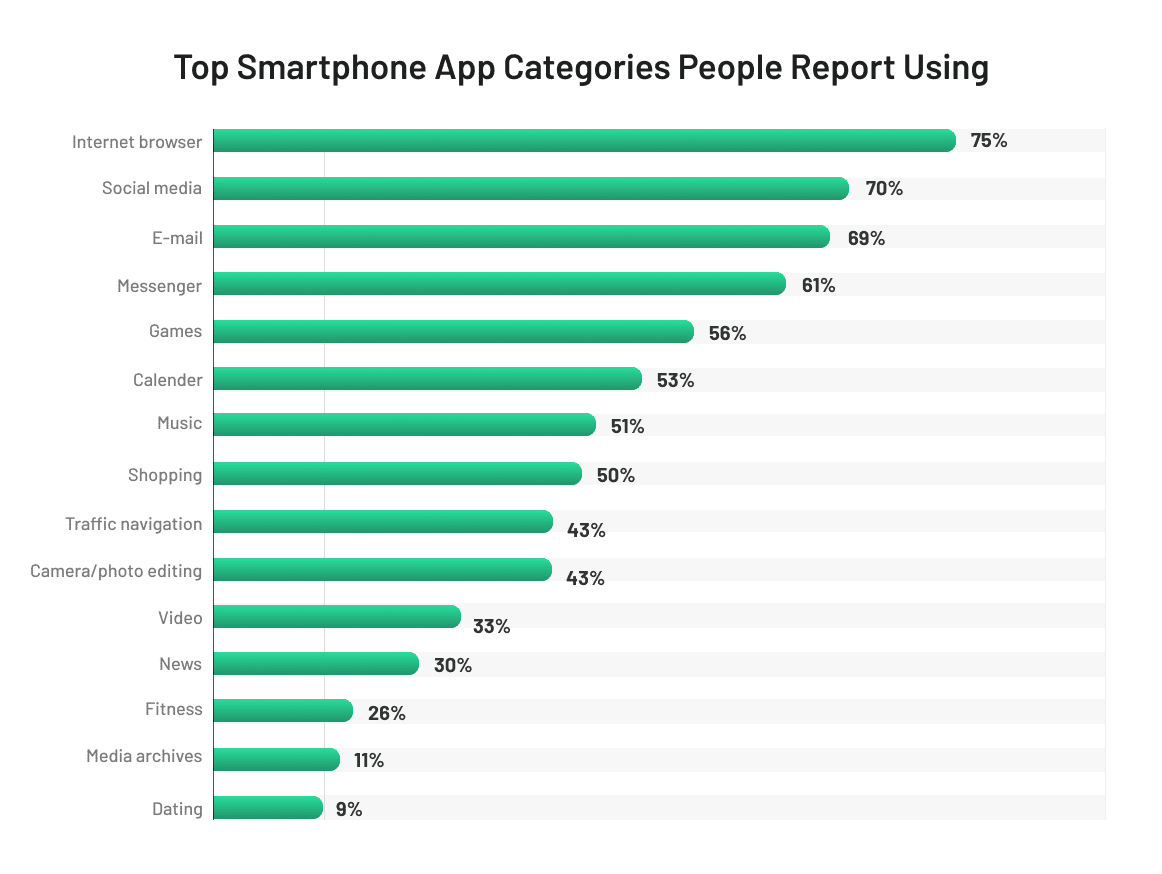
However, the use of smartphone apps predominates in several areas. There are the most popular uses for cell phones among consumers.
In the US, cell phones accounted for 96% of all digital time spent using maps. Apps for smartphones were used to view 86% of digital weather material. It is logically consistent. A smartphone is undoubtedly the most fantastic option for those who need to access maps and GPS services while on the road.
However, if you scroll down further, you will find more categories that aren’t as evident. For instance, smartphone applications account for 47% of retail sales. Despite having so many online shopping options, many people still like using their cell phones.
A second area that immediately comes to mind is news and information. Even if the percentage of smartphone users is slightly over 40%, this is still significant, given the various available platforms and channels.
Tablets versus Smartphones
Tablets and smartphones both have their differences.
If you remember from earlier, there are twice as many smartphones as tablets globally (2.7 billion vs. 1.35 billion). However, tablet use is beginning to overtake smartphone use.
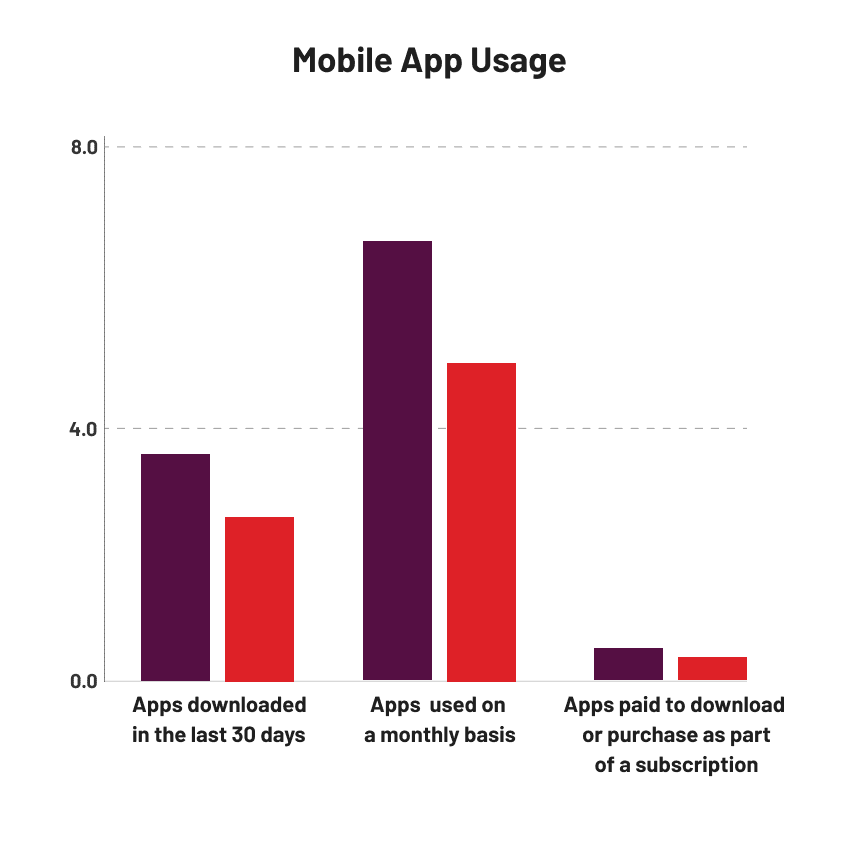
People download more applications for their cell phones each month, and they utilize more apps overall. However, as the image shows, tablets aren’t far behind. It seems reasonable that smartphone usage will increase, given that they are constantly within arm’s reach.
However, tablets narrowly surpass smartphones regarding paid applications or subscription purchases made via an app. Tablets may continue to dominate this market for many years to come.
Use of Tablets
Tablets are utilized for technical reasons, even if they may not be as common as smartphones.
The most utilized app categories for tablets are shown below.
Another situation where gaming tops a use list is this one. You may conclude that a user is more inclined to pay for gaming applications installed on a tablet if you compare this graph to the previous one. The gameplay and user experience will be improved since tablet displays are bigger. For this reason, Tablet users are likely more prepared to pay extra for downloads and subscriptions.
Usage of Mobile Apps by Country
Almost everything, including behavior, is location-dependent.
App use may be compared to this idea. We’ll examine and assess how mobile application users behave globally. You may utilize this information to discover more about the target market or spot a business opportunity in untapped areas.
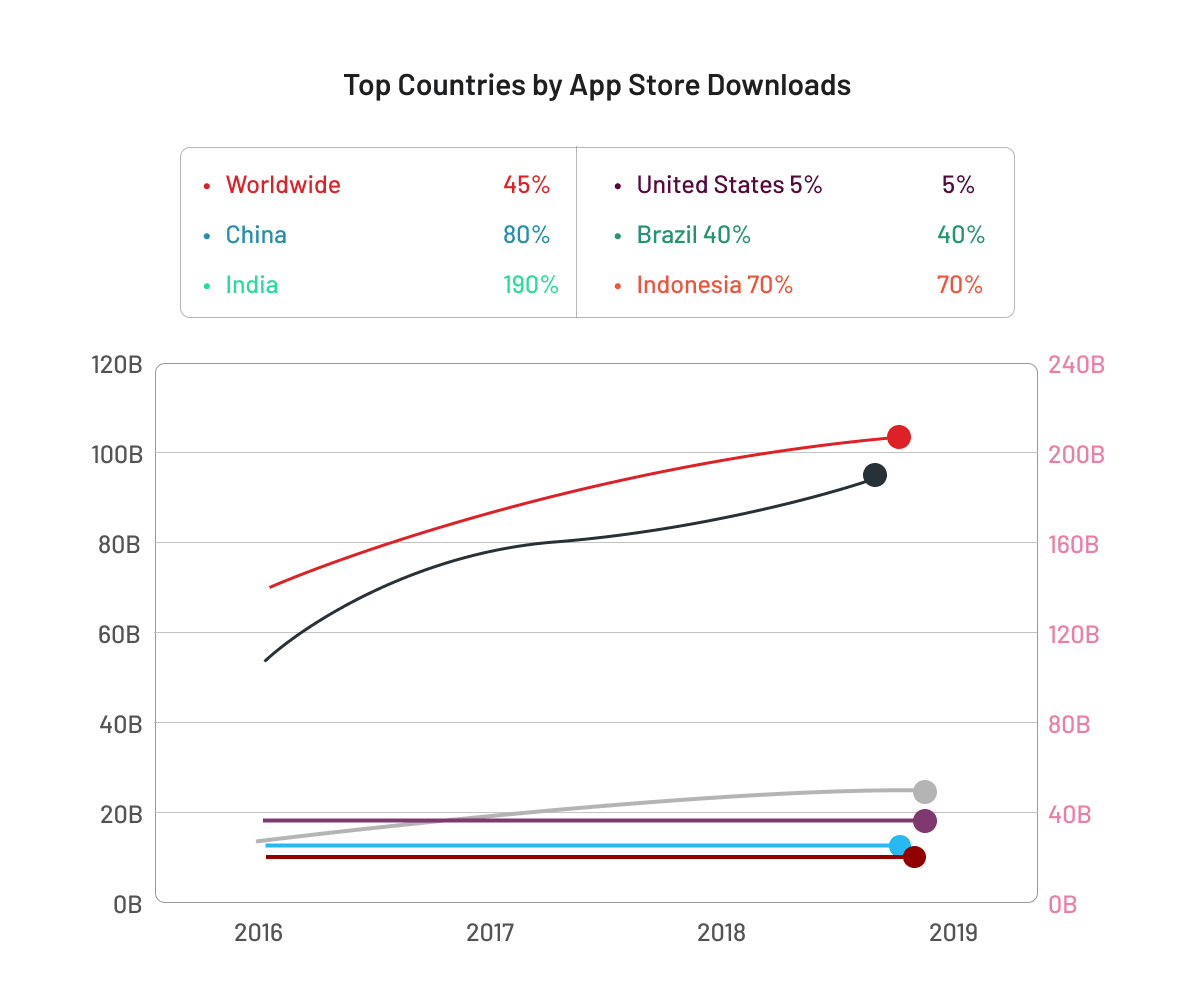
Downloads of Apps by Country
Here are the top app store downloads by the major nations throughout the globe.
The number of app downloads in China has increased by 80% during the last four years. However, Brazil, India, and other developing markets also rapidly expand. The graph shows that India’s app download growth rate was a staggering 190% during the same period. In contrast, in the US, it is just 5%.
Some firms may find the prospect of using an app to target customers abroad enticing as technology develops and becomes more widely available in developing countries worldwide.
Monthly Use of Apps (in hours)
Let’s now examine how much time users of mobile applications spend in a few global marketplaces.
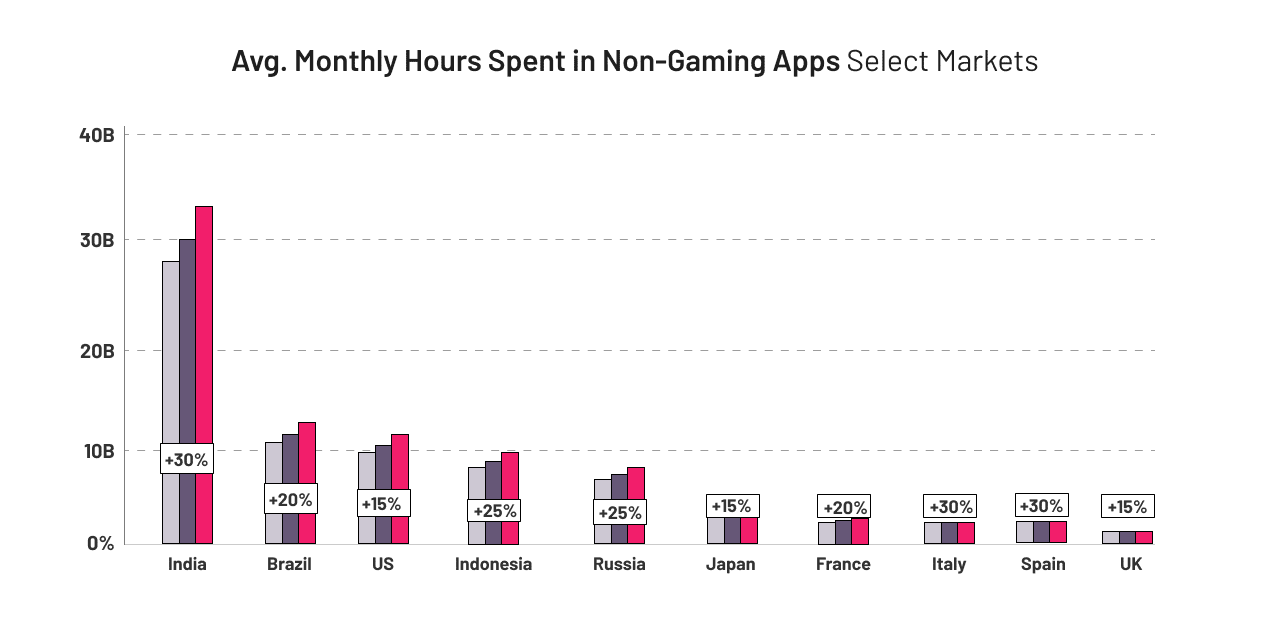
This graph is a lot like the one we saw before. It seems reasonable that people will spend more time using applications as downloads increase in India. For each of these nations, there is a single factor that never changes. Each year, more time is spent on mobile applications. Consider Italy, which has a far smaller population than India. However, between 2019 and 2020, the average amount of time spent using apps increased in each of these areas by 30%.
Downloads Worldwide for Apple vs. Google Play (iOS vs. Android)
Android takes up the majority of the market. Thus, it is no surprise that the Google Play Store receives the great majority of app downloads globally.
As you can see from the graph, the divide in the US is more or less 50/50. In Japan, downloads from the Apple App Store account for the lion’s share, but Google Play Store is in charge everywhere else.
Projections for Mobile App Growth until 2023
We can’t help but wonder what mobile app will have the most downloads in 2023 or how much time the typical user will spend using applications due to their rising reliability. These and other issues will be clarified by the data provided below.
-
Downloads from the Apple App Store and Google Play Store
2017 saw 178 billion app downloads overall, with a mind-blowing 94.12 billion coming from both the Apple App Store and Google Play Store. By the end of 2019, there will have been 204 billion app downloads, illustrating how this number has increased over time. Statistics on app use show that 114.9 billion of the totals came from the combined Apple App Store and Google Play Store.
Due to the pandemic’s increased idleness, both app stores’ quarterly app download records were shattered in 2023. Both app marketplaces will have a record 33.6 billion app downloads in Q1 2023.
-
TikTok
The epidemic has significantly increased app use in 2023. Popular applications like Zoom, Instagram, Facebook, WhatsApp, and TikTok are among those that are gaining from this increase. Within the first quarter of 2023, TikTok, in particular, received 315 million downloads from both the Apple App Store and Google Play Store. With over 115.2 million installations as of March 2023, TikTok led the non-gaming category in downloads.
-
Market Revenue for Mobile Apps
The mobile app market has generated billions of dollars in yearly income. The overall revenue generated by the mobile app market increased from $365.2 billion in 2018 to $462 billion in 2019.
The main income generators in the mobile app market have been and continue to be gaming applications. According to studies, other top income generators for mobile applications include social and networking apps, picture and video-sharing apps, and entertainment apps. According to projections, the mobile app market will bring in around $581.9 billion by the end of 2023.
-
User Interaction
If our site takes longer than three seconds to load, 53% of visitors reportedly depart. Users of mobile apps exhibit the same behaviors. According to statistics, when a mobile app takes too long to launch, 70% of users give up. Any programme that takes more than a few seconds to load dramatically increases the likelihood that it will lose consumers right away.
-
Market for Mobile Games
Statistics on app use have shown for some time that the gaming sector is the most significant income generator for the mobile app market. This remarkable record doesn’t seem to be slowing down anytime soon.
While the market for mobile games was valued at an astounding $151.9 billion in 2019, it is anticipated that it will read $165.9 billion by 2023. Because of sponsorships, subscriptions paid advertising, and in-app sales, the mobile gaming sector continues to be successful.
-
Number of Installed Apps
Smartphone owners typically have 40 applications loaded on their devices. Despite this average, the majority of smartphone users only utilize 18 applications for around 89% of their time. On the other hand, Millennials spend most of their time on 25 applications and have an average of 67 loaded on their devices.
Unfortunately, this excess leads to an additional issue. Within the first five minutes of their days, more than one-third of smartphone users check their smartphones. Another fact is that 20% of smartphone users check their devices more than 50 times daily.
-
eCommerce Revenue
Mobile applications greatly influence the success of e-commerce in the present and the future. Mobile devices are anticipated to represent more than 70% of all e-commerce purchases by the end of 2023.
-
Phones That Can Fold
Statistics show that more than 3.2 million foldable phones were shipped in 2019. Estimates indicate that this number will increase to 50 million units by 2023. That year will unquestionably be a crucial one for foldable phones in order to achieve this growth.
-
IoT Market Worldwide
According to projections, the worldwide IoT industry will have a $194 billion market value by the end of 2023. Up to $143 billion will be contributed by this software, such as mobile applications, which is a 14% increase from 2019.
-
Businesses Owned by Millennium
The millennial generation is the only one that can claim its dependency on technology. Millennials were raised in this technological era and have continued to use it as adults. As a result, it is unexpected that 55% of Millennial-owned firms use mobile applications to incorporate technology.
Conclusion
We use mobile applications regularly. The year 2022 will remain a crucial one for the mobile app market.
Every data we study reveals that even though mobile use and penetration are at an all-time high, the trend is continually rising.
It is excellent news for everyone who has or wants mobile app development for their company. However, you cannot just create an app without keeping up with recent findings and fashions; to better understand the mobile app market from a download and use viewpoint, utilize this guide as a reference.
If you are prepared to create an app in the coming years, register with Mtoag Technology and get started. With the help of qualified developers, you can quickly develop an iOS and Android app using our user-friendly platform.
What indicators are you monitoring to assess your mobile app’s use figures?